Prevalence of Flexible Flat Foot in Adults: A Cross-sectional Study
Ashok Aenumulapalli1, Manoj Mohan Kulkarni2, Achleshwar Ramnarain Gandotra3
1 Assistant Professor, Department of Anatomy, SBKS Medical Institute and Research Centre, Vadodara, Gujarat, India.
2 Associate Professor, Department of Anatomy, SBKS Medical Institute and Research Centre, Vadodara, Gujarat, India.
3 Professor and HOD, Department of Anatomy, SBKS Medical Institute and Research Centre, Vadodara, Gujarat, India.
NAME, ADDRESS, E-MAIL ID OF THE CORRESPONDING AUTHOR: Dr. Ashok Aenumulapalli, C-9, Staffquaters, Dhraj Hospital, Piparia Waghodia-391760, Vadodara, Gujarat, India.
E-mail: aenumulapalliashok@gmail.com
Introduction
Flat foot (pes planus) is a commonly observed disorder in clinical practice. The height of Medial Longitudinal Arch (MLA) determines the degree of pes planus. Majority of the previous studies on prevalence of flexible flat foot were done among children.
Aim
The present study was undertaken to determine the prevalence of flexible flat foot among 18-21-year-old Indian adults using Navicular Drop Test (NDT) which is regarded as reliable and valid method to characterise MLA.
Materials and Methods
The present study was a cross-sectional study in which Brody’s Navicular Drop Test was performed in five hundred healthy subjects (250 males and 250 females) aged 18-21-year-old. Navicular Drop (ND) of ≥ 10 mm was regarded as flexible flat foot. Statistical analysis was done using SPSS version 23.0.
Results
The prevalence of flexible flat foot was 13.6% (for males-12.8%; for females-14.4%). The median with Inter Quartile Range (IQR) for ND among males was 6 mm (4-8) and 6 mm (4-9) for right and left foot respectively. The median with IQR for ND among females was 6mm (4-10) and 7mm (3-8) for right & left respectively. The correlation of Right Side Navicular Drop (RND) with height and weight was significant, but insignificant correlation was found between RND and BMI. The correlation of Left Side Navicular Drop (LND) with height, weight and BMI of individuals was statistically not significant. The difference between the ND of males and female group was statistically not significant.
Conclusion
The present study quantified the prevalence of flexible flat foot and gender wise normative values of ND among 18-21-year-old Indian adults. The information obtained by this study will be useful in the field of orthopaedics.
Medial longitudinal arch, Navicular drop, Pes planus
Introduction
The structure and dynamicity of foot arches are essential for functions of foot like shock absorption, body weight transmission and to act as a lever for propelling the body forward during locomotion [1,2]. Medial Longitudinal Arch (MLA) of foot is higher than the Lateral longitudinal arch and its curvature flattens to variable degree during weight bearing [3-6]. Pes planus is a medical condition where the curvature of MLA is more flat than normal and entire sole of the foot comes into near complete or complete contact with the ground [7]. The height of MLA is most important measurement in determining the degree of pes planus [8].
The feet appear to be flat in infants due to presence of fat. The arches become prominent when the child starts walking and the foot starts bearing the weight [9]. The arches of foot rapidly develop between two to six years and become structurally mature around 12-13 years [10]. Prevalence of flat feet is higher in children due to ligament laxity and declines with age. Early shoe wearing in children impairs the development of longitudinal arches [11].
Flat foot deformity was classified into three subtypes by Harris RT and Beath T, viz. rigid flat foot, Flexible Flat Foot (FFF) and Flexible Flat Foot With Short Tendo-Achilles (FFF-STA) [12]. FFF is generally asymptomatic while FFF-STA gives rise to pain and functional disability. Rigid flat foot is often symptomatic and associated with tarsal coalitions and reduced range of motion at subtalar joint.
The true prevalence of flat foot is uncertain due to lack of exact clinical or radiographic criteria for defining flat foot [13]. The prevalence of flat feet has been investigated by many researchers in different parts of the world. Higher prevalence (21 to 57%) is reported among children of two to six years which declines (13.4% to 27.6%) in primary school children [14]. In adult population, it is reported to be approximately 5 to 14% by different researchers [10,15,16].
Literature on the prevalence of adult flat foot in Indian population is limited and wherever it is available the methods employed to determine the flat feet, such as Foot print method or Visual Assessment method, are less reliable [17,18]. So the present study was undertaken to investigate the prevalence of FFF among adults (18 to 21-year-old) by using NDT which has proven to be more valid. Additionally, the study also aimed to find out the correlation of ND with demographic variables such as Height, Weight and Body Mass Index (BMI) of the individual.
Materials and Methods
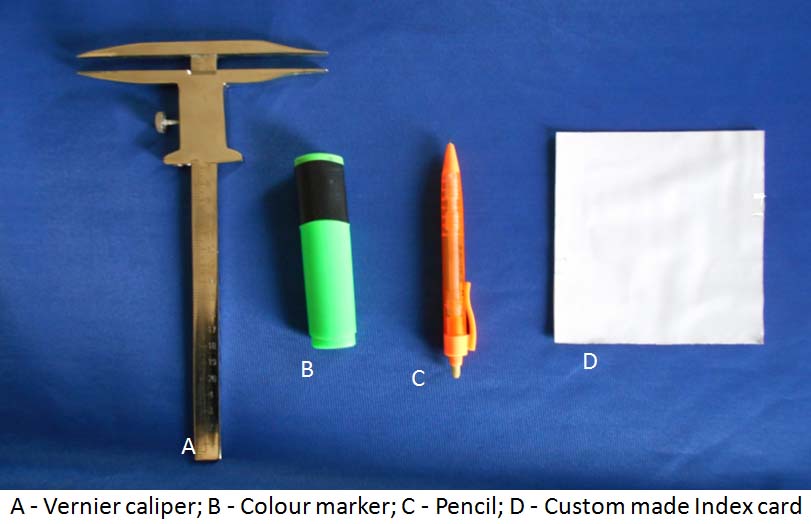
It was a cross-sectional study in which five hundred (250 males and 250 females) healthy subjects of age between 18 to 21 years from Gujarat region had volunteered. None of the participant had any lower extremity deformity, injury or neuromuscular disorder at the time of assessment. The author obtained ethical clearance from Institutional Ethical Committee and informed consent from the participants before undertaking the study. The materials used for this study were custom made index card and Vernier caliper [Table/Fig-1]. The demographic data such as gender, age, height, weight of each participant were recorded. The ND was measured applying Brody Method [3].
Materials required for the study.
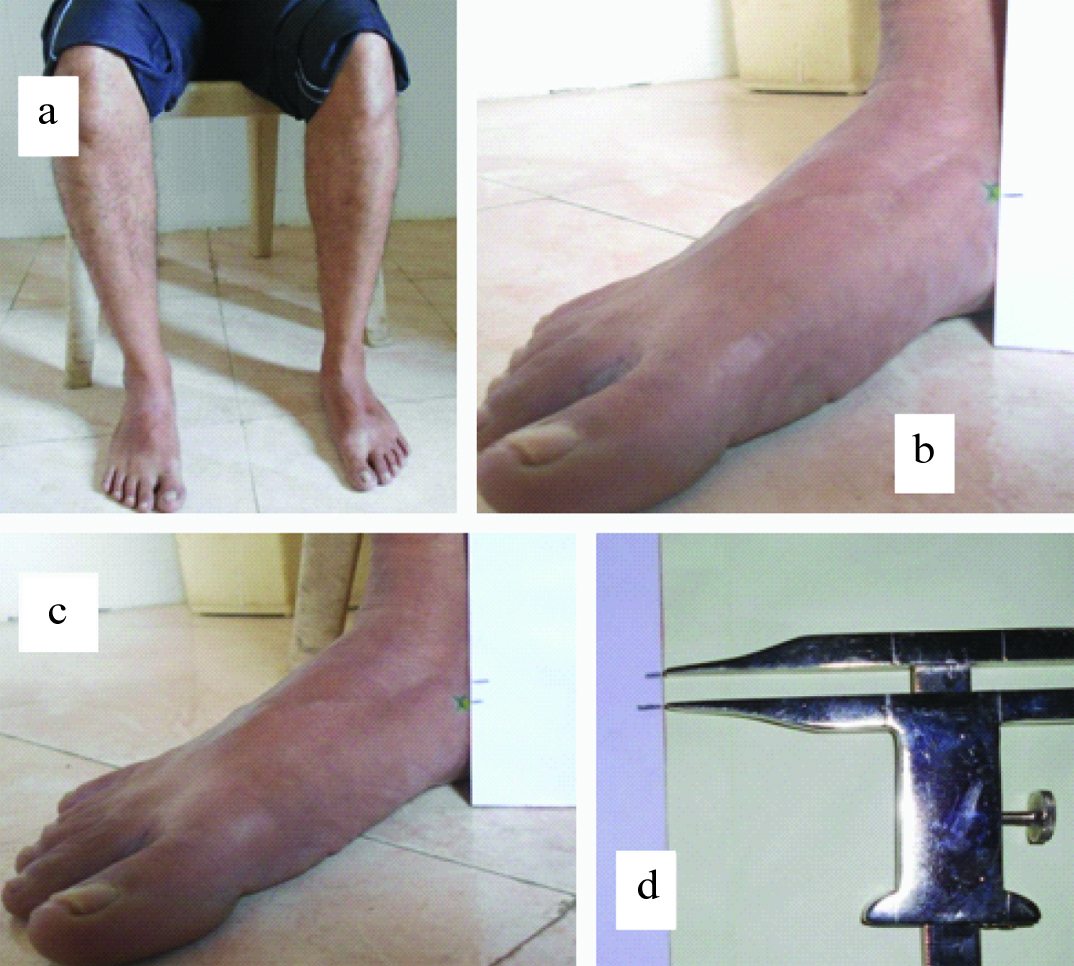
Each subject was asked to sit in relaxed position with hip and knee flexed at 90 degree and the foot gently placed flat on a firm supporting surface [Table/Fig-2a]. The observer ensured that the ankle and subtalar joints were placed in neutral position. The height of navicular tuberosity in this position was marked on the index card [Table/Fig-2b]. The subject was then asked to stand with equal weight on both the feet. Now the new height of Navicular tuberosity was marked on index card [Table/Fig-2c]. The difference between the marks on the index card (ND) was measured with Vernier caliper [Table/Fig-2d]. The ND was measured for both feet in each subject.
Procedure for measurement of Navicular Drop for study participant; a) Subject in sitting position with hip and knee flexed at 90 degree and ankle in neutral position; b) Navicular height on an index card in sitting position (non weight bearing); c) Navicular height on an index card in standing position (weight bearing); d) Measurement of Navicular Drop by using Vernier caliper.
Statistical Analysis
SPSS version 23.0 was used for analysing the data. The normality of the data was tested using Shapiro-Wilk test. Median and Inter Quartile Range (IQR) were calculated for the demographic parameters and ND since the data was not normally distributed. The ND among males and females was compared using Mann-Whitney U test. The criteria to determine flat foot was ND of ≥ 10 mm. Using this criteria, the prevalence was calculated separately for males and females and also for entire study population. A p-value of less than 0.05 was considered statistically significant.
Results
Participants in the present study were adults, in the age group of 18 to 21 years. The distribution of height, weight, BMI, Right Side Navicular Drop (RND), Left Side Navicular Drop (LND) amongst study population was calculated [Table/Fig-3]. The normality of distribution was tested with Shapiro-Wilk test. The data was not normally distributed. So we have also expressed Median and Inter Quartile Range (IQR) for descriptive statistics.
Distribution of height, weight, BMI and Navicular Drop (ND) among study sample.
| Height (cm) | Weight (kg) | BMI (kg/m2) | RND (mm) | LND (mm) |
|---|
| Male (N=250) | Mean (±SD) | 169.6 (±8.16) | 68.1 (±15.6) | 23.62 (±4.91) | 6.7 (±4.1) | 6.9 (±4.2) |
| Median (IQR) | 170 (165 to 175) | 65.50 (57 to 77) | 23.02 (20.14 to 26.22) | 6 (4 to 8) | 6 (4 to 9) |
| Range | 140-190 | 36-114 | 15.41 – 39.04 | 0-19 | 0-22 |
| Female (N=250) | Mean (±SD) | 156.5 (±7.05) | 52.7 (±10.4) | 21.5 (±3.96) | 7.2 (±4.4) | 6.3 (±4) |
| Median (IQR) | 156.25 (15.5-160) | 50 (45-58) | 20.75 (18.38-23.28) | 6 (4-10) | 7 (3-8) |
| Range | 125.5182 | 36-90 | 15.72 – 35.38 | 0-21 | 0-18 |
| Total (N=500) | Mean (±SD) | 163.07 (±10.07) | 60.41 (±15.36) | 22.56 (±4.58) | 7 (±4) | 6.6 (±4.1) |
| Median (IQR) | 162.5 (155.5-170.5) | 57 (49-69) | 21.6 (13.14-25.28) | 6 (4-9) | 6 (4-9) |
| Range | 125.5-190 | 36-114 | 15.41 – 39.04 | 0-21 | 0-22 |
(RND = Right Navicular Drop; LND = Left Navicular Drop)
The ND between male and female groups was compared using Mann-Whitney U test. The difference was statistically not significant on right as well as on left side [Table/Fig-4].
Comparison of Navicular Drop (ND)
| RND (Males vs Females) | LND (Males vs Females) | RND vs LND (for Total sample) |
|---|
| Mann-Whitney U test | 28878.50 | 28431.50 | 119641.5 |
| p-value | 0.14 | 0.08 | 0.2 |
(RND = Right Navicular Drop; LND = Left Navicular Drop) *Mann-Whitney U test
Similarly, the measurements of RND and LND for entire study sample were also compared using Mann-Whitney U test. The difference between RND and LND was statistically not significant [Table/Fig-4].
The correlation of ND with weight, height and BMI was evaluated using Spearman’s correlation test. The correlation of RND with height and weight was significant, but insignificant correlation was found between RND and BMI. The correlation of LND with height, weight and BMI of individuals was statistically not significant [Table/Fig-5].
Correlation between Navicular Drop with BMI, weight and height.
| Correlation with | Spearman’s rho | p-value |
|---|
| RND | Height | -.109 | .014 |
| Weight | -.123 | .006 |
| BMI | -.075 | .095 |
| LND | Height | .068 | .127 |
| Weight | .033 | .466 |
| BMI | -.002 | .958 |
RND = Right Navicular Drop; LND = Left Navicular Drop) *Spearman’s correlation test
The criteria to determine FFF used by the present study was ND of ≥ 10 mm. In the study population, 13.6% individuals were found with ND of ≥ 10 mm in both the feet (Males=12.8% and Females=14.4%). The prevalence of FFF was calculated using the above mentioned criteria [Table/Fig-6].
Prevalence of flat foot in study sample.
| Sample size | Right side | Left side | Bilateral |
|---|
| Males | 250 | 53 (21.2%) | 54 (21.6%) | 32 (12.8%) |
| Females | 250 | 71 (28.4%) | 48 (19.2%) | 36 (14.4%) |
| Total | 500 | 124 (24.8%) | 102 (20.4%) | 68 (13.6%) |
Discussion
Pes planus is a common condition found in adult population. Adult flat foot is defined as a foot condition that persists or develops after skeletal maturity and is characterised by partial or complete loss (collapse) of the MLA [19]. Adult flat foot is generally asymptomatic but can present with pain, functional disability and various degrees of deformity. It can be constitutional or acquired. The causes of adult pes planus include posterior tibial tendon dysfunction, tarsal coalition, peroneal spastic flat foot, iatrogenic, post-traumatic arthritis, Charcot foot or neuromuscular flat foot [20].
The prevalence of flat foot is very high in children which decreases with age as the skeletal maturity advances. Majority of previous studies on prevalence of flat foot were done in children. The purpose of this study was to determine the prevalence of FFF among 18-21-year-old age group through the NDT and to find out its correlation with demographic variables.
The ND is defined as the change in height of the navicular bone when the foot moves from subtalar neutral non weight bearing to a relaxed weight bearing stance [21]. The normal value for static ND has been suggested as lower than 10 mm by Brody DM and Muller MJ et al., [3,4]. So the present study considered a ND of ≥ 10 mm as FFF.
The prevalence of bilateral FFF was found to be 13.6% in our study sample. Inconsistent values for flat foot prevalence among adult population have been reported by various researchers [Table/Fig-7]. This can be attributed to the different methods used to assess the flexibility of the arches of foot. The present study applied ‘NDT’ to assess the flexibility of the MLA. The method of ND has proved to be more valid and reliable compared to foot print and visual assessment methods applied by other researchers [17,18]. Moreover, very few researchers have reported separate values of flat foot prevalence for male and female groups. Present study observed the prevalence of FFF among males and females to be 12.8% and 14.4% respectively.
Comparison of prevalence of flat foot of present study with previous workers.
| Researchers | Sample Size | Age (Yrs) | Method Used | Prevalence of Flat foot |
|---|
| Bhoir MT [10] | 80 | 18-25 | FPI (Foot Posture Index) | 11.25% |
| Ukoha U et al., [15] | 649 | 18-27 | Arch Index | 13.9% |
| Ganapathy A et al., [16] | 250 | 18-24 | PAI (Plantar Arch Index) | 5.2% |
| Present study | 500 | 18-21 | Navicular Drop Test (NDT) | 13.6% |
There is no consensus over normal values of ND among different researchers. Also, the researchers have employed different methods to measure the ND. Brody DM, Muller MJ et al., and Beckett ME et al., have reported the values of 15 mm, 13 mm and 10 mm respectively as the upper limit of range of ND in their study population [3,4,22]. Very few studies have reported gender wise separate values of ND for right and left foot. Current study found the median values with IQR for ND among male population as 6 mm (4-8) and 6 mm (4-9) on right and left sides respectively. The median with IQR for ND among female population were found as 6mm (4-10) and 7mm (3-8) for right and left sides respectively. The mean/median values have been also reported by various authors in the past [Table/Fig-8] [5,6,23-25].
Comparison of range of Navicular Drop reported in present study with previous workers.
| Researchers | Method | Navicular Drop (mm) |
|---|
| Bandholm L [5] | Ruler (1mm resolution) | Mean (±SD) = 5±2.2 |
| Chang YW [6] | Surface markers | Mean (±SD) = 7.38±3.04 |
| Fiolkowski P [23] | Ruler | Mean (±SD) = 6±2 |
| Nakhaee Z [24] | Cardboard card | Mean (±SD) = 5.3±2 |
| Adhikari U et al., [25] | Vernier Caliper | Median (IQR): RND for Males= 6(3-8); RND for Females= 4(3-5); LND for Males= 4(3-6); LND for Females= 3(2-5); |
| Present study | Vernier Caliper | Median (IQR): RND for Males= 6(4-8); RND for Females= 6(4-10); LND for Males= 6(4-9); LND for Females= 7(3-8) |
Fukano M and Fukubayashi have stated that normal values of ND are difficult to establish as ND is influenced by various factors like foot length, age, gender and BMI [26]. Present study evaluated the correlation of ND with weight, height and BMI. The correlation of RND with height and weight was significant, but insignificant correlation was found between RND and BMI. The correlation of LND with height, weight and BMI of individuals was statistically not significant. Also, the difference in ND between male and female group was statistically insignificant.
None of the participants of present study had any complaints related to their feet like pain, numbness, restricted mobility etc. We agree with the views of Milenkonvic S et al., that in adults, the FFF may be considered as normal variant of strong and stable foot instead of deformity resulting from bony or muscular abnormalities [27].
Conclusion
The present study has quantified the prevalence of adult flexible flat foot in age group of 18 to 21 years. The study has estimated gender wise normative values for ND and influence of height, weight and BMI on ND. The information obtained by this study will be useful in the field of orthopaedics.
(RND = Right Navicular Drop; LND = Left Navicular Drop)
(RND = Right Navicular Drop; LND = Left Navicular Drop) *Mann-Whitney U test
RND = Right Navicular Drop; LND = Left Navicular Drop) *Spearman’s correlation test
[1]. Ker RF, Bennett MB, Bibby SR, Kester RC, Alexander RM, The spring in the arch of the human footNature 1987 325(6100):147-49. [Google Scholar]
[2]. Ogon M, Aleksiev AR, Pope MH, Wimmer C, Saltzman CL, Does arch height affect impact loading at the lower back level in running?Foot & ankle International 1999 20(4):263-66. [Google Scholar]
[3]. Brody DM, Techniques in the evaluation and treatment of injured runnerThe Orthopaedic Clinics of North America 1982 13(3):541-58. [Google Scholar]
[4]. Mueller MJ, Host JV, Norton BJ, Navicular drop as a composite measure of excessive pronationJournal of the American Podiatric Medical Association 1993 83(4):198-202. [Google Scholar]
[5]. Bandholm T, Boysen L, Haugaard S, Benke J, Foot medial longitudinal arch deformation during quiet standing and gait in subjects with medial tibial stress syndromeThe Journal of Foot and Ankle Surgery 2008 47(2):89-95. [Google Scholar]
[6]. Chang YW, Hung W, Wu HW, Measurements of foot arch in standing, level walking, vertical jump and sprint startInternational Journal of Sport and Exercise Science 2010 2(2):31-38. [Google Scholar]
[7]. Lovett HW, Dane J, The affections of the arch of the foot commonly classified as flat-footThe Journal of Bone & Joint Surgery 1896 8(1):78-92. [Google Scholar]
[8]. Yalcin N, Esen E, kanatali V, Yetkin H, Evaluation of medial longitudinal arch:a comparison between the dynamic plantar pressure measurement system and radiographic analysisActa Orthop Traumatol Turc 2010 44(3):241-45. [Google Scholar]
[9]. Gore AJ, Spencer JP, The newborn footAmerican Family Physician 2004 69(4):865-72. [Google Scholar]
[10]. Bhoir MT, Prevalence of flat foot among 18-25 years old physiotherapy students:cross sectional studyIndian Journal of Basic and Applied Medical Research 2014 3(4):272-78. [Google Scholar]
[11]. Rao UB, Joseph B, The influence of foot wears in the prevalence of flat foot- A survey of 2300 childrenThe Journal of Bone & Joint Surgery 1992 74(4):525-27. [Google Scholar]
[12]. Harris RI, Beath T, Army foot survey. An investigation of foot ailments in Canadian soldiers. Report No. 1574 Ottawa, OntarioNational Research Council of Canada 1947 44:1-268. [Google Scholar]
[13]. Shih YF, Chen CY, Chen WY, Lin HC, Lower extremity Kinematics in children with and without flexible flatfoot:a comparative studyBMC Musculoskeletal Disorders 2012 13(1):31 [Google Scholar]
[14]. Vittore D, Patella V, Petrera M, Caizzi G, Ranieri M, Putignano P, Extensor deficiency:first cause of childhood flexible flat footOrthopaedics 2009 32(1):28 [Google Scholar]
[15]. Ukoha U, Egwer OA, Okafov IJ, Ogugua PC, Igwenagu NV, Pes Planus:Incedence in adult population in Anambra state, Southeast NigeriaIndian Journal of Basic and Applied Medical Research 2012 3(3):166-68. [Google Scholar]
[16]. Ganapathy A, Sadeesh T, Rao S, Morphometric analysis of foot in young adult individualsWorld Journal of Pharmacy and Pharmaceutical Sciences 2015 4(8):980-93. [Google Scholar]
[17]. Menz HB, Alternative techniques for the clinical assessment of foot pronationJournal of American Podiatric Medical Association 1998 88(3):119-29. [Google Scholar]
[18]. Murely GS, Menz HB, Landorf KB, A protocol for classifying normal and flat-arched foot posture for research studies using clinical and radiographic measurementsJournal of Foot and Ankle Research 2009 2(1):22 [Google Scholar]
[19]. Volpon JB, Foot print analysis during the growth periodJournal of Pediatric Orthopaedics 1994 14(1):83-85. [Google Scholar]
[20]. Ricco I, Gimigliano R, Porpora G, Iolascon G, Rehabilitative treatment in Flexible flat foot:A perspective cohort studyMusculoskeletal Surgery 2009 93(3):101-07. [Google Scholar]
[21]. Razeghi M, Batt ME, Foot type classification:a critical review of current methodsGait & Posture 2002 15(3):282-91. [Google Scholar]
[22]. Beckett ME, Massie DL, Bowers KD, Stoll DA, Incidence of Hyperpronation in the ACL Injured knee:A clinical PerspectiveJournal of athletic training 1992 27(1):58-62. [Google Scholar]
[23]. Fiolkowski P, Brunt D, Bishop M, Horodyski M, Intrinsic pedal musculature support of the medial longitudinal arch:an electromyography studyThe Journal of Foot and Ankle Surgery 2003 42(6):327-33. [Google Scholar]
[24]. Nakhaee Z, Rahimi A, Abaee M, The relationship between the height of the medial longitudinal arch (MLA) and the ankle and knee injuries in professional runnersThe Foot 2008 18(2):84-90. [Google Scholar]
[25]. Adhikari U, Arulsingh W, Pai G, Normative values of Navicular drop test and the effect of demographic parameters –A cross sectional studyAnnals of Biological Research 2014 5(7):40-48. [Google Scholar]
[26]. Fukano M, Fukubayashi T, Motion characteristics of the medial and lateral longitudinal arch during landingEuropean Journal of Applied Physiology 2009 105(3):387-92. [Google Scholar]
[27]. Milenkovic S, Zivkovic M, Bubanj S, Incidence of flat foot in high school student series:Physical Education and Sport 2011 9(3):275-81. [Google Scholar]