Echocardiography is the standard means for the assessment of aortic stenosis severity. Cardiac catheterization is not routinely recommended [1-3], except when echocardiography is difficult due to technical reasons like poor acoustic window or when the results are discrepant with clinical findings. However, accurate quantitation of stenosis severity is essential for decision making about patient management [4].
The most common causes of valvular aortic stenosis are bicuspid aortic valve, calcific aortic valve disease and rheumatic heart disease. Calcific aortic stenosis caused by atherosclerosis, calcification and ossification is the most common cause of aortic stenosis in industrialized nations [5]. However, worldwide, rheumatic aortic stenosis is more prevalent [6].
The objective of the study was to evaluate the echocardiographic correlation between the aortic valve area calculated by continuity equation and MACS in patients with valvular aortic stenosis and to find a cut-off value of MACS for detecting severe aortic stenosis.
Materials and Methods
The prospective observational study was carried out in a tertiary care center in Southern India. The study population included consecutive patients attending cardiology outpatient department with clinical evidence of dominant aortic valve stenosis and who were referred for echocardiographic evaluation. A total of 59 eligible patients during one year period (March 2010 to February 2011) were enrolled in the study. Patients having moderate to severe aortic regurgitation, significant mitral valve disease, left ventricular dysfunction and poor acoustic window were excluded from the study.
Detailed echocardiographic evaluation was done as per the recommendations of the American Society of Echocardiography and European Association of Echocardiography [7]. M mode and two-dimensional echocardiographic imaging were performed in the standard fashion in parasternal long- and short-axis views and apical views. Aortic leaflet separation in M mode was identified as the distance between the inner edges of the tips of these structures at mid systole in the parasternal long axis view [8]. Cuspal separation was also measured in 2D echocardiography from the parasternal long axis view and the average of the two values was taken as the MACS. Peak velocity across aortic valve, mean aortic valve gradient and Left Ventricular Outflow Tract (LVOT) velocity were measured. Aortic valve area was calculated using continuity equation after careful measurement of LVOT diameter. Patients were grouped into mild, moderate and severe aortic stenosis based on the aortic valve area- >1.5 cm2, 1-1.5 cm2 and <1 cm2 respectively [7].
Statistical Analysis
To study the association between maximal leaflet separation on cross-sectional echocardiogram and peak transvalvular aortic gradient as well as the calculated aortic valve area, Pearson correlation coefficient and scatter plots were used. Analysis of variance was used to study the variation of MACS values over different categories of aortic valve area. To assess the diagnostic validity, positive and negative predictive values, positive likelihood ratios and ROC curves were used.
Results
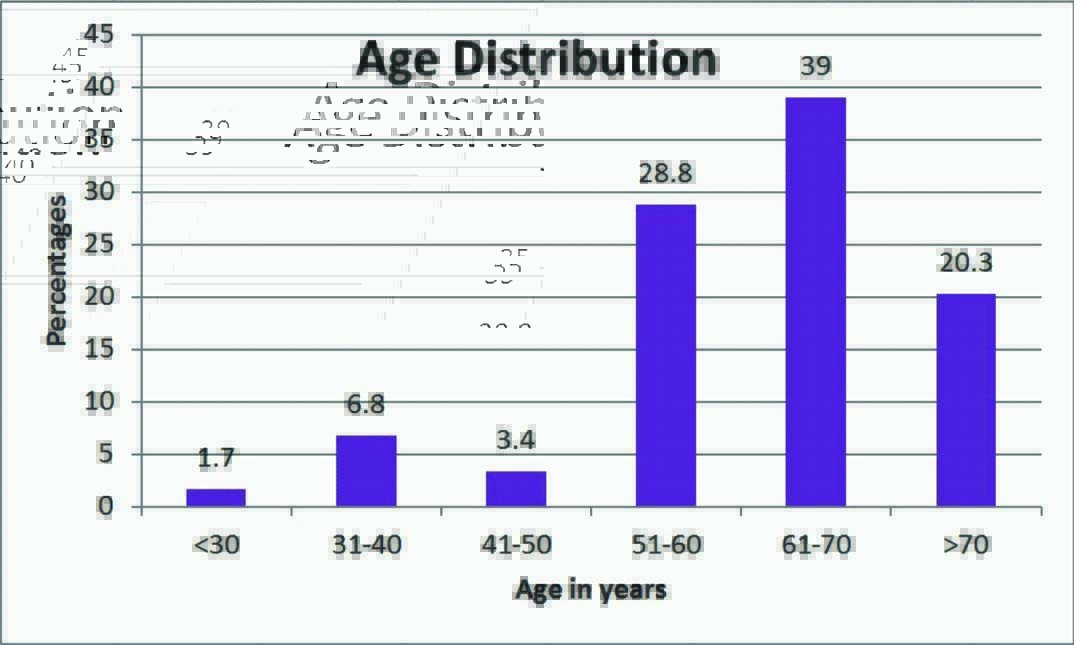
A total of 59 patients were included in the study. Of the total 45 patients were males and 14 patients were females. Most of the cases were degenerative/calcific (78%) followed by rheumatic (13.5%) and bicuspid (8.5%). Most of the patients (59%) were aged more than 60 years [Table/Fig-1].
Age distribution of patients with aortic valve stenosis.
Twenty seven patients had severe and 16 each had moderate and mild aortic stenosis. Mean MACS was 6.89 mm in severe aortic stenosis. Mean MACS were 9.97 mm and 12.36 mm in moderate and mild aortic stenosis [Table/Fig-2]. The observed differences in mean values between the three groups were analyzed using F-test (ANOVA) and found significant (p<0.001).
Mean MACS values and severity of aortic stenosis-shows significant difference between the three groups (p<0.001).
| Aortic Stenosis | N | MACS | F | P |
|---|
| Mean | SD |
|---|
| Severe | 27 | 6.89 | 0.99 | 72.351 | <0.001 |
| Moderate | 16 | 9.97 | 1.38 |
| Mild | 16 | 12.36 | 1.05 |
| Total | 59 | 9.21 | 2.58 |
* MACS - Maximal aortic valve cusp separation
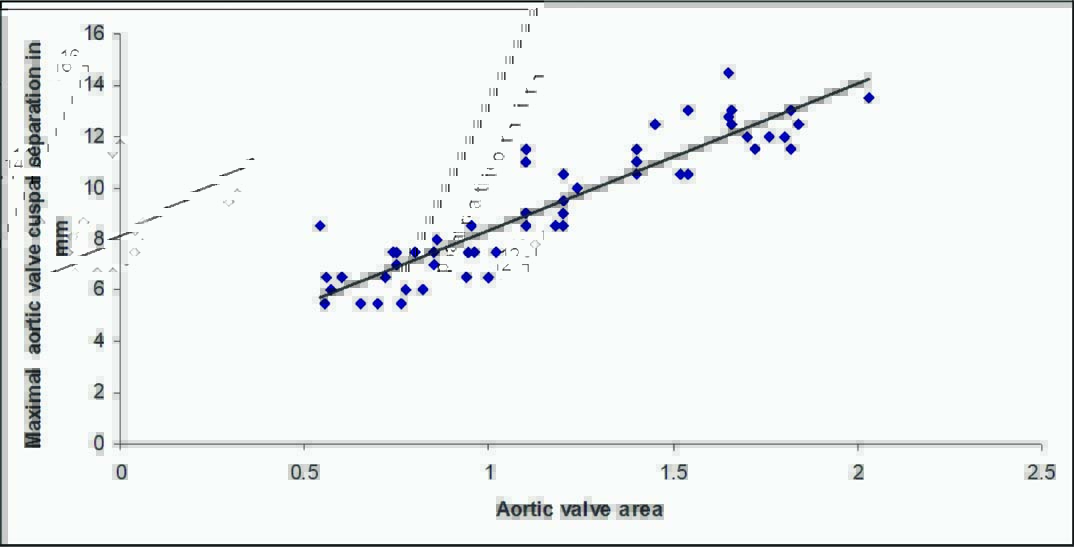
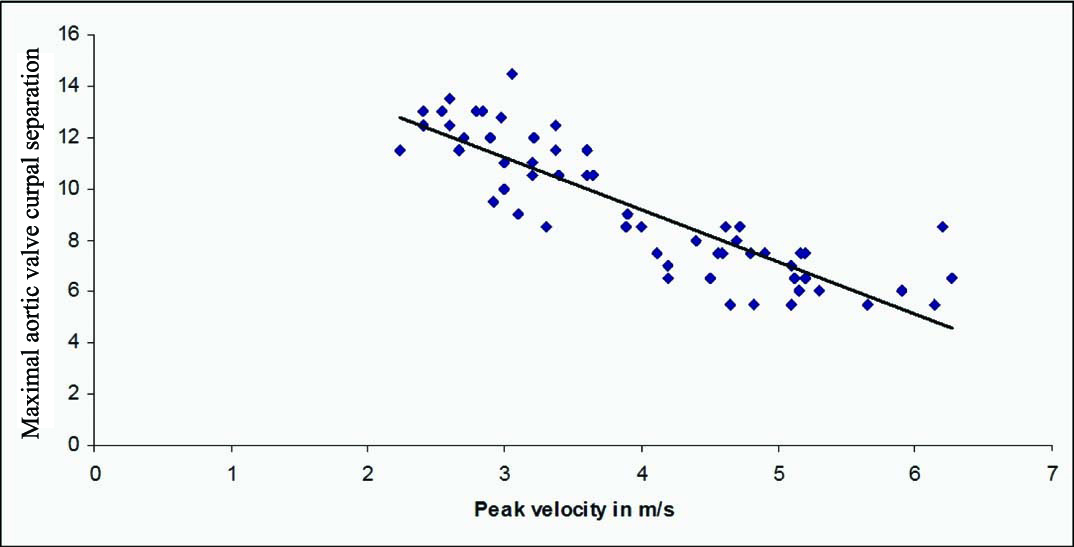
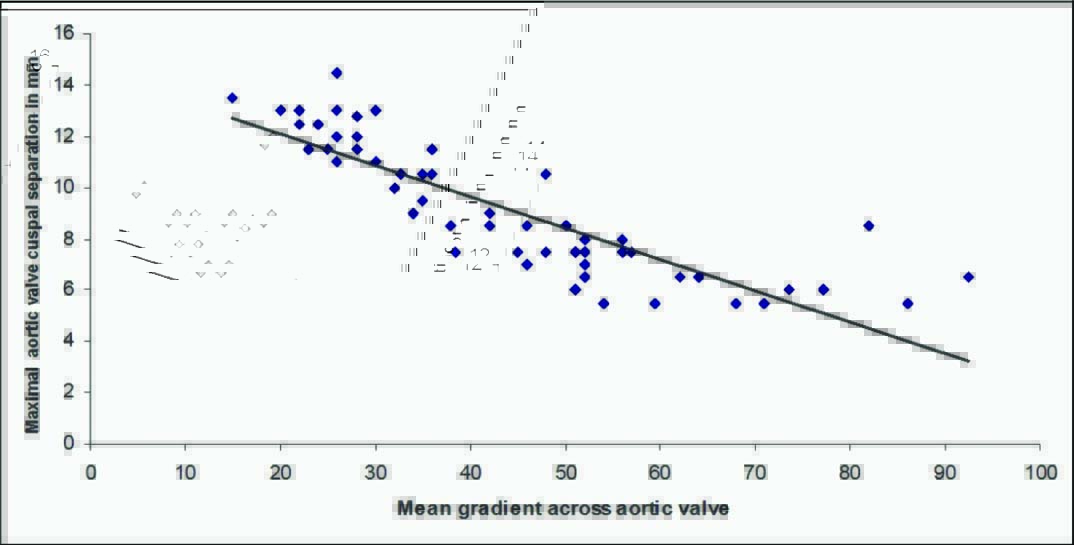
There was a significant correlation [Table/Fig-3,4 and 5] between the decrease in aortic cusp separation and aortic valve area (r=0.916, p<0.001), peak aortic velocity (r=-0.866, p<0.001) and mean aortic valve gradient (r=-0.85, p<0.001).
Scatter diagram showing strong positive correlation between MACS and aortic valve area (r=0.916, p<0.001).
* MACS - Maximal aortic valve cusp separation
Scatter diagram showing strong negative correlation between MACS and peak aortic Doppler velocity (r=-0.866, p<0.001).
* MACS - Maximal aortic valve cusp separation
Scatter diagram showing strong negative correlation between MACS and aortic mean gradient (r=-0.85, p<0.001).
* MACS - Maximal aortic valve cusp separation
ROC curves were used for finding the optimum cut off values of MACS for predicting severe and mild aortic stenosis [Table/Fig-6-9]. Aortic cuspal separation < 8.25 mm showed a sensitivity of 89%, specificity of 94%, positive predictive value of 92 %, negative predictive value of 91% and predictive accuracy of 92% in detecting severe aortic stenosis. Aortic cuspal separation ≥11.25 mm had a sensitivity of 88%, specificity of 93%, positive predictive value of 95 %, negative predictive value of 82% and predictive accuracy of 92% in detecting mild aortic stenosis.
ROC curve for finding the optimum cut off value of MACS for predicting severe aortic stenosis; area under the curve 0.966, SE 0.022, p<0.001.
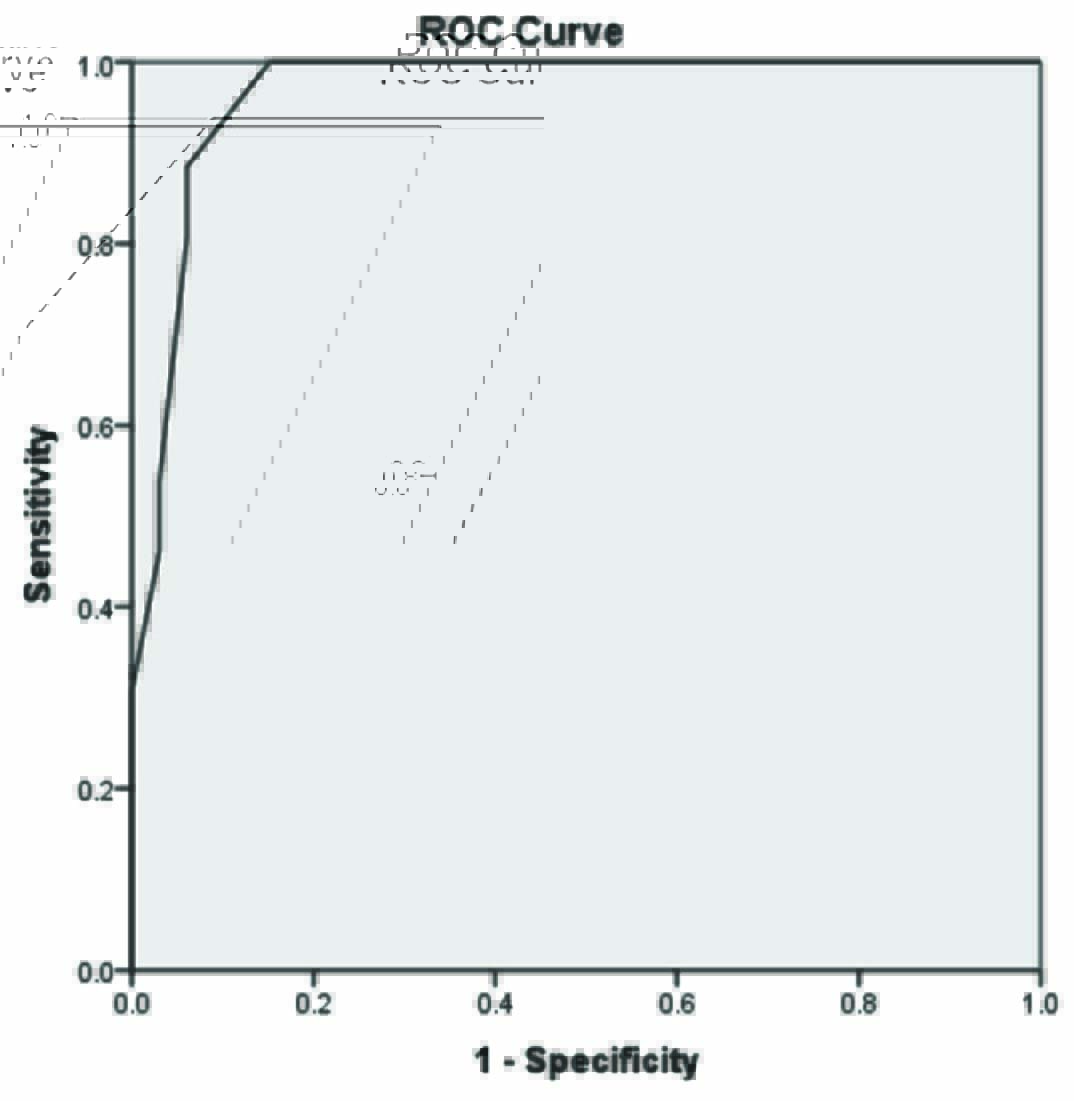
Sensitivity and specificity of different cut-off values to predict severe aortic stenosis.
| Positive (Severe AS) if MACS value (in mm) | Sensitivity | Specificity |
|---|
| <6.75 | 0.462 | 0.970 |
| <7.25 | 0.538 | 0.970 |
| <7.75 | 0.808 | 0.939 |
| <8.25 | 0.885 | 0.939 |
| <8.75 | 1.000 | 0.848 |
| <9.25 | 1.000 | 0.788 |
| <9.75 | 1.000 | 0.758 |
| <10.25 | 1.000 | 0.727 |
*AS - Aortic stenosis *MACS - Maximal aortic valve cusp separation
ROC curve for finding the optimum cut off value of MACS for predicting mild AS; area under the curve 0.969, SE 0.019, p<0.001.
* AS - Aortic stenosis.
* MACS - Maximal aortic valve cusp separation.
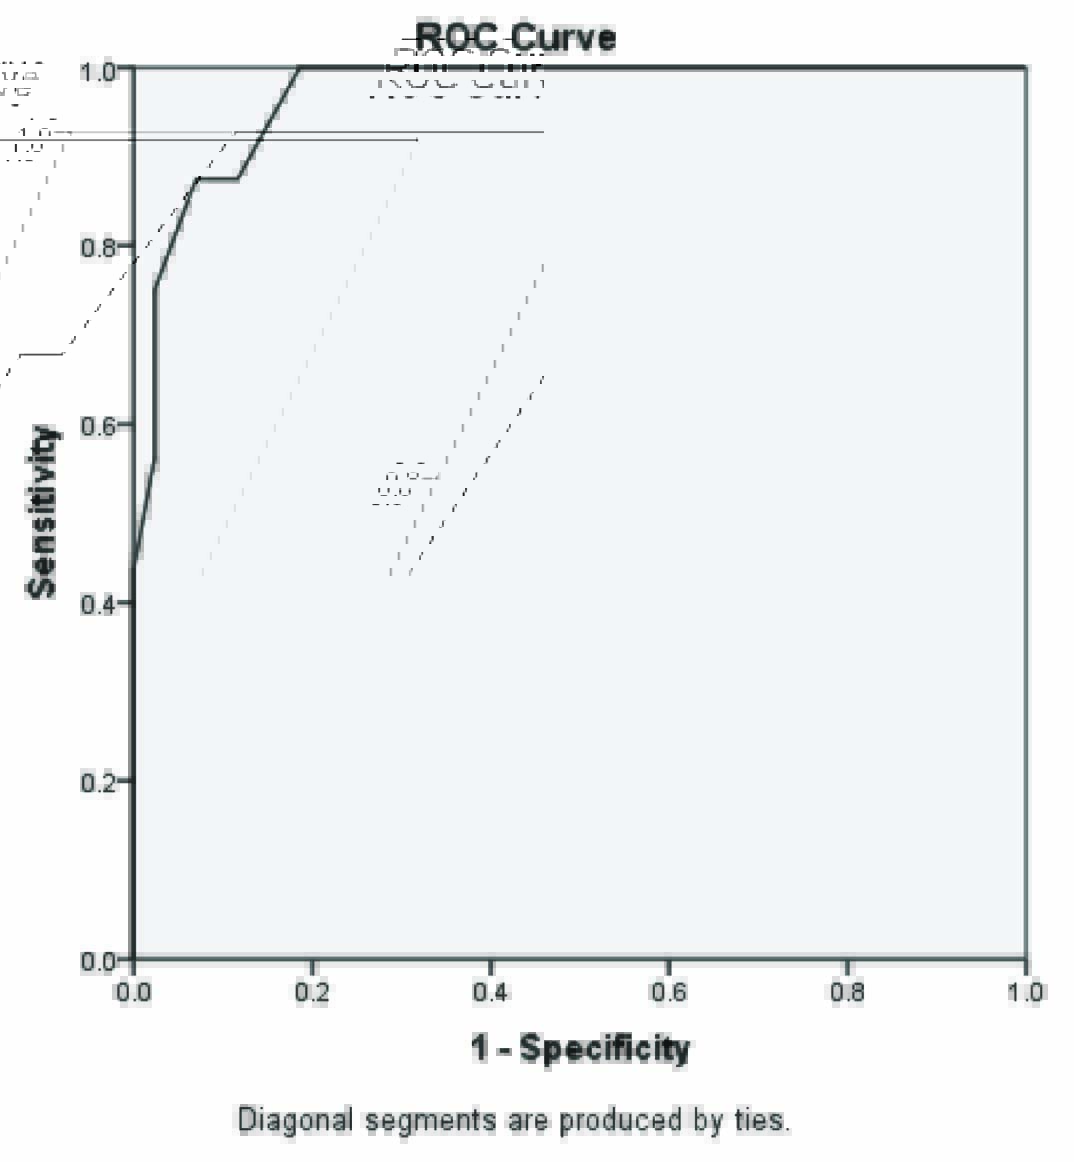
Sensitivity and specificity of different cut-off values to predict mild aortic stenosis.
| Positive (Mild AS) if MACS value (in mm) | Sensitivity | Specificity |
|---|
| ≥9.25 | 1.000 | 0.767 |
| ≥9.75 | 1.000 | 0.791 |
| ≥10.25 | 1.000 | 0.814 |
| ≥10.75 | 0.875 | 0.884 |
| ≥11.25 | 0.875 | 0.930 |
| ≥11.75 | 0.750 | 0.977 |
| ≥12.25 | 0.563 | 0.977 |
| ≥12.65 | 0.438 | 1.000 |
*AS - Aortic stenosis *MACS - Maximal aortic valve cusp separation
Discussion
Diminished excursion of the valve leaflets in aortic valve stenosis results in decreased aortic cusp separation, which is used as an indicator of the severity of aortic stenosis in echocardiography [8]. The validity of this index in patients with isolated aortic valve disease by M mode and 2D echocardiographic evaluation as well as during cardiac catheterization has been validated in many earlier studies.
Chang S et al., studied echocardiographic cusp separation and morphology of the valve during surgery in 22 patients and found good correlation between the two [9]. In the study by De Maria AN et al., aortic cuspal separation <8 mm had a sensitivity of 82% in predicting severe aortic stenosis [8]. In another study by Weyman AE et al., the maximum aortic valve diameter recorded during the cross-sectional study averaged 7.9 ± 1.8 mm in patients with severe aortic stenosis, 11.6 ± 2.3 mm in moderate aortic stenosis and 16.9 ± 2.0 mm in patients with mild aortic stenosis [10].
Motro M et al., assessed the severity of aortic stenosis by echocardiography in 81 consecutive adult patients, 40 of whom underwent cardiac catheterization. Aortic valve separation of 7 mm or less correlated with severe aortic stenosis while significant aortic valve stenosis was ruled out if the separation was 12 mm or more [11].
In the present study, there was a strong correlation between aortic cuspal separation and severity of aortic stenosis. Aortic cuspal separation <8.25 mm showed a sensitivity of 89%, specificity of 94%, positive predictive value of 92%, negative predictive value of 91% and predictive accuracy of 92% in detecting severe aortic stenosis. Aortic cuspal separation ≥11.25 mm had a sensitivity of 88%, specificity of 93%, positive predictive value of 95%, negative predictive value of 82% and predictive accuracy of 92% in detecting mild aortic stenosis.
MACS can be extremely useful in two clinical situations as a simple screening tool for assessment of stenosis severity and also helps in decision making non invasively when there is discordance between the other echocardiographic parameters of severity of aortic stenosis.
Limitation
Relatively small sample size. Patients with severe aortic stenosis are over represented in the cohort as they are more symptomatic and more often seek medical attention. Trans-aortic pressure gradient by Doppler echo and hence, the valve area calculation can be influenced by other factors like pressure recovery phenomenon and severity of left ventricular diastolic dysfunction, which are not accounted for in the present study.
Conclusion
Measurement of MACS by echocardiography is a simple echocardiographic method to assess severity of valvular aortic stenosis. There is a strong correlation between MACS and aortic valve area measured by continuity equation and the peak and mean transvalvular aortic gradients.
MACS can be complementary to other echocardiographic parameters used for the assessment of severity of aortic valve stenosis. It may also be used as a simple screening tool to diagnose severe aortic stenosis, with high sensitivity, specificity and positive predictive value.
* MACS - Maximal aortic valve cusp separation
*AS - Aortic stenosis *MACS - Maximal aortic valve cusp separation
*AS - Aortic stenosis *MACS - Maximal aortic valve cusp separation