The worldwide prevalence of obesity has increased to more than double between 1980 and 2014 [11]. Risks of cardiovascular disease, hypertension, type II diabetes mellitus, osteoarthritis, gall bladder disease, and many types of cancer have increased with increasing degree of obesity. Low level of VO2max has been established as an independent risk factor for cardiovascular mortality [12]. It is also considered as a casual risk factor for prediction of future hypertension [13]. BMI is a surrogate marker of body fat and is calculated from the weight and height of the subject [14]. But it has a major limitation that it does not distinguish between body fat and FFM [15]. BIA is a validated indirect method for assessing the relative proportion of fat mass and FFM [16].
With this background, this study was aimed to determine the correlation of BMI, Fat% and FFM with VO2max in young adults.
Materials and Methods
A cross-sectional study was carried out in the Postgraduate Research Laboratory of Department of Physiology, MKCG Medical College, Odisha, India, from October 2015 to July 2016. Clearance from the Institutional Ethics Committee was obtained beforehand. Sample size of the study was calculated with reference of previous published research papers [17-19]. Formula used for sample size calculation was:
N={(Zα+Zβ)/C}2+3
Where N= Total number of subjects required
Zα/Zβ = The standard normal deviate for α/β
C=0.5 x ln{(1+r)/(1-r)}
r= expected correlation coefficient [20].
For this study, the expected correlation coefficient was r=0.48 with α=0.05 and power of study 95%. Twenty percent extra subjects were included assuming a higher dropout rate. After taking written consent, 60 apparently healthy medical students in the age group of 18-25 years were taken as study population. All of them were asked to fill up the PAR-Q [21]. Three male subjects were excluded due to unfitness in screening by PAR-Q. One male and two females dropped out from the study due to their unwillingness for participation in exercise. The study group (n=54, male=30, female=24) were requested to fulfill the pre-test criteria for exercise and BIA test.
Abstain from eating or drinking >4 hours
Abstain from strenuous exercise >24 hours
Abstain from caffeine, chocolate, alcohol and nicotine >48 hours
Void bladder completely within 30 minutes of test.
The test and assessment was carried out between 10.00 am to 12.00 pm to avoid circadian variation. An air-conditioned room temperature was set at 23ºC. Anthropometric and body fat% measurements were taken in the laboratory in light clothing with adequate privacy. One female attendant was present during test of female subjects. Height was measured by stadiometer in centimeter to nearest 0.1 cm. Weight was measured by digital weighing scale with 0.1 kg sensitivity. Body fat% was measured by BIA method [23,24] using low current of 50 kHz, 500 µA. FFM was calculated by subtracting fat mass from body weight {FFM= Body weight – (Body weight * Fat%)}. BMI was calculated by Quetelet’s equation {BMI= Weight (kg)/Height (m)2}. Subjects were briefed about the aim of the exercise and a full demonstration of procedure was shown. They were familiarized with the instruments and trial was given before performing the actual test. The computerized treadmill (RMS Vega 201 Stress Test System) program was set according to the first two stages of the Bruce Treadmill Protocol [25] with a warm-up period of two minutes at gravitational level (0% grade) [Table/Fig-1]. Test termination criteria were followed according to ACSM’s guidelines for exercise testing and prescription [26].
Stages for exercise on treadmill. Stage 1 and 2 are first two stages I of Bruce Treadmill Protocol. {1% Grade = tan-1 (1/100)° angle}.
| Stages | Time (min:sec) | Speed (mph) | Grade (%) |
|---|
| Warm up | 2:00 | 1.7 | 0 |
| Stage 1 | 3:00 | 1.7 | 10 |
| Stage 2 | 3:00 | 2.5 | 12 |
Test Termination Criteria
Onset of angina or angina like symptoms;
Decrease in systolic Blood Pressure (BP) of >10 mmHg from resting BP;
Excessive increase in BP (systolic >250 mmHg or diastolic >115 mmHg);
Failure of HR to increase with increased exercise intensity;
Shortness of breath or wheezing;
Leg cramps or claudication;
Nausea, light-headedness, confusion, ataxia, pallor, cyanosis, cold clammy skin;
If subject requests to stop
Steady state HR for each stage was recorded during the exercise. Continuous blood pressure was measured for checking appearance of any test termination criteria. VO2max was calculated from the following formula [22].
Calculation
VO2max was calculated as
VO2max (mL.kg-1.min-1) = m (HRmax – HR2) + VO22
Where, HRmax = 220 – Age in years
HR2 = Steady state heart rate for Stage 2
VO22 = Submaximal predicted VO2 for Stage 2
m = Slope of the HR and VO2 = (VO22 - VO21)/ (HR2 – HR1)
VO2 for any stage was calculated as:
VO2 (mL.kg-1.min-1) = {(Speed in m.min-1) x 0.1} + {(Speed in m.min-1) x 1.8 x Grade in decimal} + 3.5
Speed conversion: 1 mph = 26.8 m.min-1
Statistical Analysis
Data obtained were stored for statistical analysis. For Pearson correlation, we set α (two-sided) = 0.05 and Power of study = 95%. Unpaired t-test, Pearson correlation and linear regression analysis were done in GraphPad Prism 6 for Windows (Version 6.01, 2012) and in Microsoft Excel® 2010 for Windows.
Results
Mean age of subjects (n=54) was 20.09±2.92 years. Mean VO2max (mL.kg-1.min-1) of male was 43.25±7.25 and female was 31.65±2.10. The difference was statistically significant (p <0.001) [Table/Fig-2].
VO2max of male and female subjects.
| Variable | Male (n=30) | Female (n=24) | t-test p-value* |
|---|
| VO2max (ml. kg-1.min-1) | 43.25±7.25 | 31.65±2.10 | <0.001 |
Unpaired t-test with 95% confidence interval, two tail p-value <0.05 was considered statistically significant.
Mean BMI of male subjects was 25.14±4.61 which was in ‘pre-obese’ category. BMI of female subjects was 24.53±2.27 which was in ‘normal’ range according to WHO BMI criteria [27]. Fat% of female subjects was higher (32.89±3.06) than male subjects (23.65±5.55) and the difference was statistically significant (p<0.001). Fat% of female was in unhealthy (too high) range of body fat% (i.e., more than 32%) and that of male was in acceptable range (higher end) of body fat% (i.e., 16-24%) according to Lohman categorization [5,28]. FFM of male subjects (54.55±9.11) kg was higher than female subjects (41.71±4.52) kg. Unpaired t-test was done to compare these three parameters between male and female and the result is shown in [Table/Fig-3].
Comparison of BMI, fat% and FFM between male and female subjects.
| Parameters | Male (Mean±SD) | Female (Mean±Sd) | t-test, p-value* |
|---|
| BMI (kg/m2) | 25.14±4.61 | 24.53±2.27 | 0.5553 |
| Fat% | 23.65±5.55 | 32.89±3.06 | <0.001 |
| FFM (kg) | 54.55±9.11 | 41.71±4.52 | <0.001 |
Unpaired t-test with 95% confidence interval, two tail p value <0.05 was considered statistically significant.
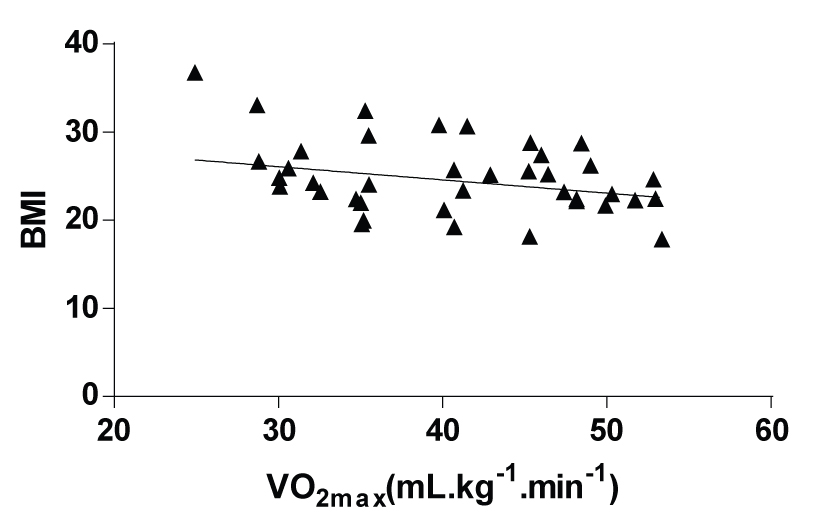
While doing correlation study, it showed that BMI has a negative correlation (r= -0.3232, p=0.0171) with VO2max.
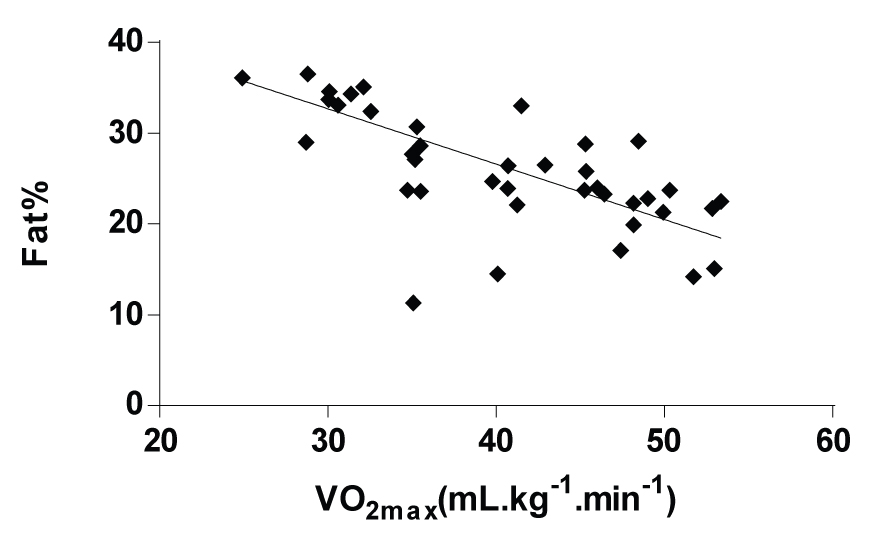
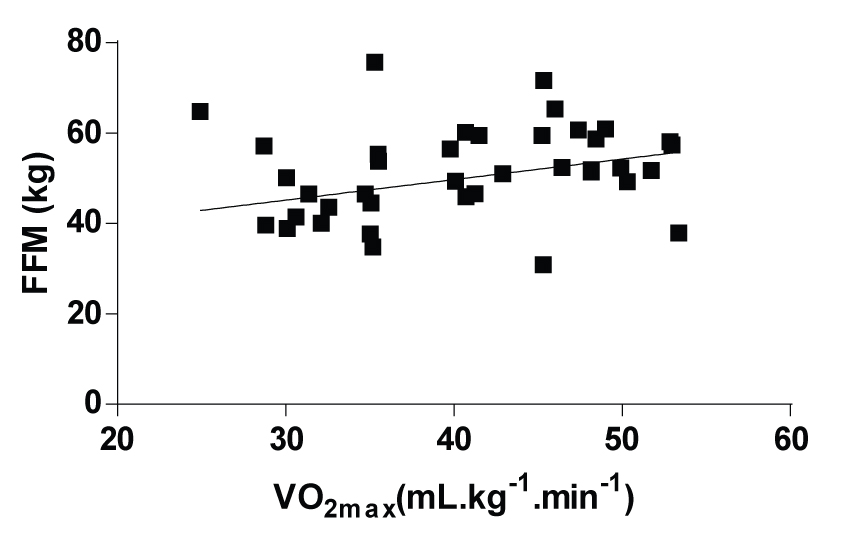
[Table/Fig-4] shows the linear regression graph between BMI and VO2max. Fat% had a strong negative correlation (r=-0.7505, p<0.0001) with VO2max. The linear regression graph between Fat% and VO2max is shown in [Table/Fig-5]. FFM was positively correlated (r=0.3727, p=0.0055) with VO2max which is presented as linear regression graph with trend line in [Table/Fig-6].
Relationship between BMI and VO2max. {R2 = 0.1045, F = 6.065, p = 0.0171, Equation: Y=-0.1502*X+30.59}.
Relationship between fat% and VO2max. {R2 = 0.5633, F = 67.08, p = <0.001, Equation: Y=-0.6090*X+50.96}.
Relationship between FFM and VO2max. {R2 = 0.1389, F = 8.390, p = 0.0055, Equation: Y=0.4542*X+31.54}.
Discussion
VO2max is the one of the best measure of fitness for exercise. However, measuring VO2max is not only intended to predict fitness for exercise, it also helps in identifying future health risks associated with low VO2max. The subjects participated in this study lead a sedentary life style and none of them were exercising. There is no normative values for categorization of level of VO2max, but according to the percentile value by Cooper Institute, the mean VO2max (ml.kg-1.min-1) of male (43.25±7.25) was in ‘fair’ and female (31.65±2.10) was in ‘poor’ category [26]. According to the WHO BMI category, females were in ‘normal range’ of BMI and their aerobic capacity was less than male subjects who were in ‘pre-obese’ category according to BMI. This difference may be due to different type of distribution of fat and FFM in male and female. Though the result indicated a negative correlation (r= -0.32) between BMI and VO2max, the R2 value (0.10) suggest it to be a weak correlation. Shetty P et al., Laxmi CC et al., Sterkowicz S et al., Hsieh PL et al., also found a negative correlation between BMI and VO2max [17,18,29,30].
Male and female both had higher than average fat% according to Lohman categorization [5,28]. Both of them also had fat% more than of ‘fitness’ level of body fat% if we consider the American Council on Exercise categorization [31]. Lack of exercise or sedentary lifestyle of the subjects may be the cause of this increased level of fat%. Result of this study showed strong negative correlation between fat% (r= -0.75) and VO2max. Hence, a young adult person with increased body fat% would have less aerobic capacity compared with a person with low body fat%. This finding supports the study of Minasian V et al., Watanabe K et al., Amani AR et al., Sharma VK et al., and Ostogic SM et al., [19,32-35]. Though the age of the subjects of these studies was different than our study, but the negative effect of increased body fat on VO2max is evident.
Sedentary life style or inadequate physical activity is not only associated with increase in body fat%, it is also a cause of decrease in relative muscle mass. More the muscle mass involved in exercise, greater the contribution of muscle pump to venous return. Hence, increase in muscle mass help to receive an increased cardiac output. In this study, we found a positive correlation (r=0.3727) between the FFM and VO2max. Though this is not a strong correlation, but the positive correlation coefficient indicates that increase in FFM may be responsible for increased VO2max. This result supports the finding of the study by Morinder G et al., who found the correlation coefficient almost similar to this study [36]. Studies by Goran M et al., and Vsetulova E et al., also found positive correlation between the VO2max and FFM but with different correlation coefficient values [37,38].
There was higher correlation coefficient of fat% and VO2max compared to that of BMI and VO2max. This finding indicates obesity in terms of fat% is a better parameter than BMI for prediction of low cardiorespiratory functional status of young adults. Therefore, during exercise prescription, if feasible, measurement of total body fat% is more acceptable parameter than BMI. Increase in regular physical activity or exercise may help decrease in body fat% which may help in relative increase in FFM and increase in VO2max. The beneficial effect of exercise on increment of VO2max has been established in study by Shete AN et al., Hence, a suggestion to reduce body fat% by the help of increased physical activity or exercise would help to decrease health risks in young adults [39].
Limitation
In this study, we took only healthy young adult students of age group 18-25 years. A study with different age groups with wide range of BMI and fat% may provide a better scenario of relation between the obesity and aerobic capacity in general population. Determination of VO2max with submaximal treadmill exercise test based on HR-VO2 relationship though validated and widely used is not a gold standard test.
Conclusion
Increased body fat% is associated with decreased level of VO2max and increase in FFM helps in increasing the VO2max in healthy young adults. Obesity in terms of fat% is a better determinant than BMI for a low VO2max.
*Unpaired t-test with 95% confidence interval, two tail p-value <0.05 was considered statistically significant.
*Unpaired t-test with 95% confidence interval, two tail p value <0.05 was considered statistically significant.