Recent studies have shown that calcium deposition in the coronary arteries narrows the lumen area and is related to arterial stenosis [17-19]. It is important to note that in all the previous studies, the correlations are restricted to calcium area without taking the neighborhood frames into consideration. The current study utilizes a complementary idea by introducing the volume concept. Recently, Araki T et al., found a link between aCCV with automated carotid Intima-Media Thickness (IMT) from B-mode ultrasound in coronary artery disease population [5,6,7,13,20].
A high degree of correlation existed between CAD and calcification of the vessel wall [21]. Calcified plaque is only produced in the atheroma region which is between external elastic lamina (vessel region), and the internal elastic lamina (lumen region) in the coronary artery as shown in [Table/Fig-1]. In this study, we measured mCLV and mCVV by an experienced cardiologist, while mCAV was calculated by subtracting mCLV from mCVV. For PCI planning, it is essential to have an exact understanding of the extent to which calcium volume is correlated to the lumen, vessel, and atheroma volume regions in the coronary artery, which is unclear in above studies. In this work, we utilize the hypothesis that Coronary Calcium Volumes (CCV) relate to: (i) coronary vessel volume; (ii) lumen volume; and (iii) atheroma volume. The block diagram of the proposed system is as shown in [Table/Fig-2]. This shows the extraction of CCV from the given IVUS videos and then developing the correlation with manual reading namely: mCVV, mCLV, and mCAV computed using iMAP software (Boston Scientific®).
Materials and Methods
In this volumetric correlation study, nineteen patients IVUS data were taken from a single-center study [5] who underwent PCI between July 2009 and December 2010 with stable angina pectoris. Out of 19 patients, 17 were men and 3 women in the age group of 36 to 79 (average age of 66 years).
In this, nine patients had proximal lesion location, six at the middle and four at a distal location. Eleven patients had calcium present on the left anterior descending coronary artery, seven on the right coronary artery, two on the left circumflex coronary artery and two on the left main coronary artery.
The mean total cholesterol, LDL cholesterol, and HDL cholesterol were 169.47 mg/dl, 97.47 mg/dl, and 46.58 mg/dl, respectively and mean haemoglobin was 6.04 g/dl. Eleven patients from the pool of twenty-two, were smokers. Before performing coronary intervention procedure, a mixed dose of clopidogrel (75 mg/day) and aspirin (100 mg/day) were given to the patients. Prior to the procedure, intravenous unfractionated heparin was also given to obtain a partial thromboplast in a time of fewer than 250 seconds.
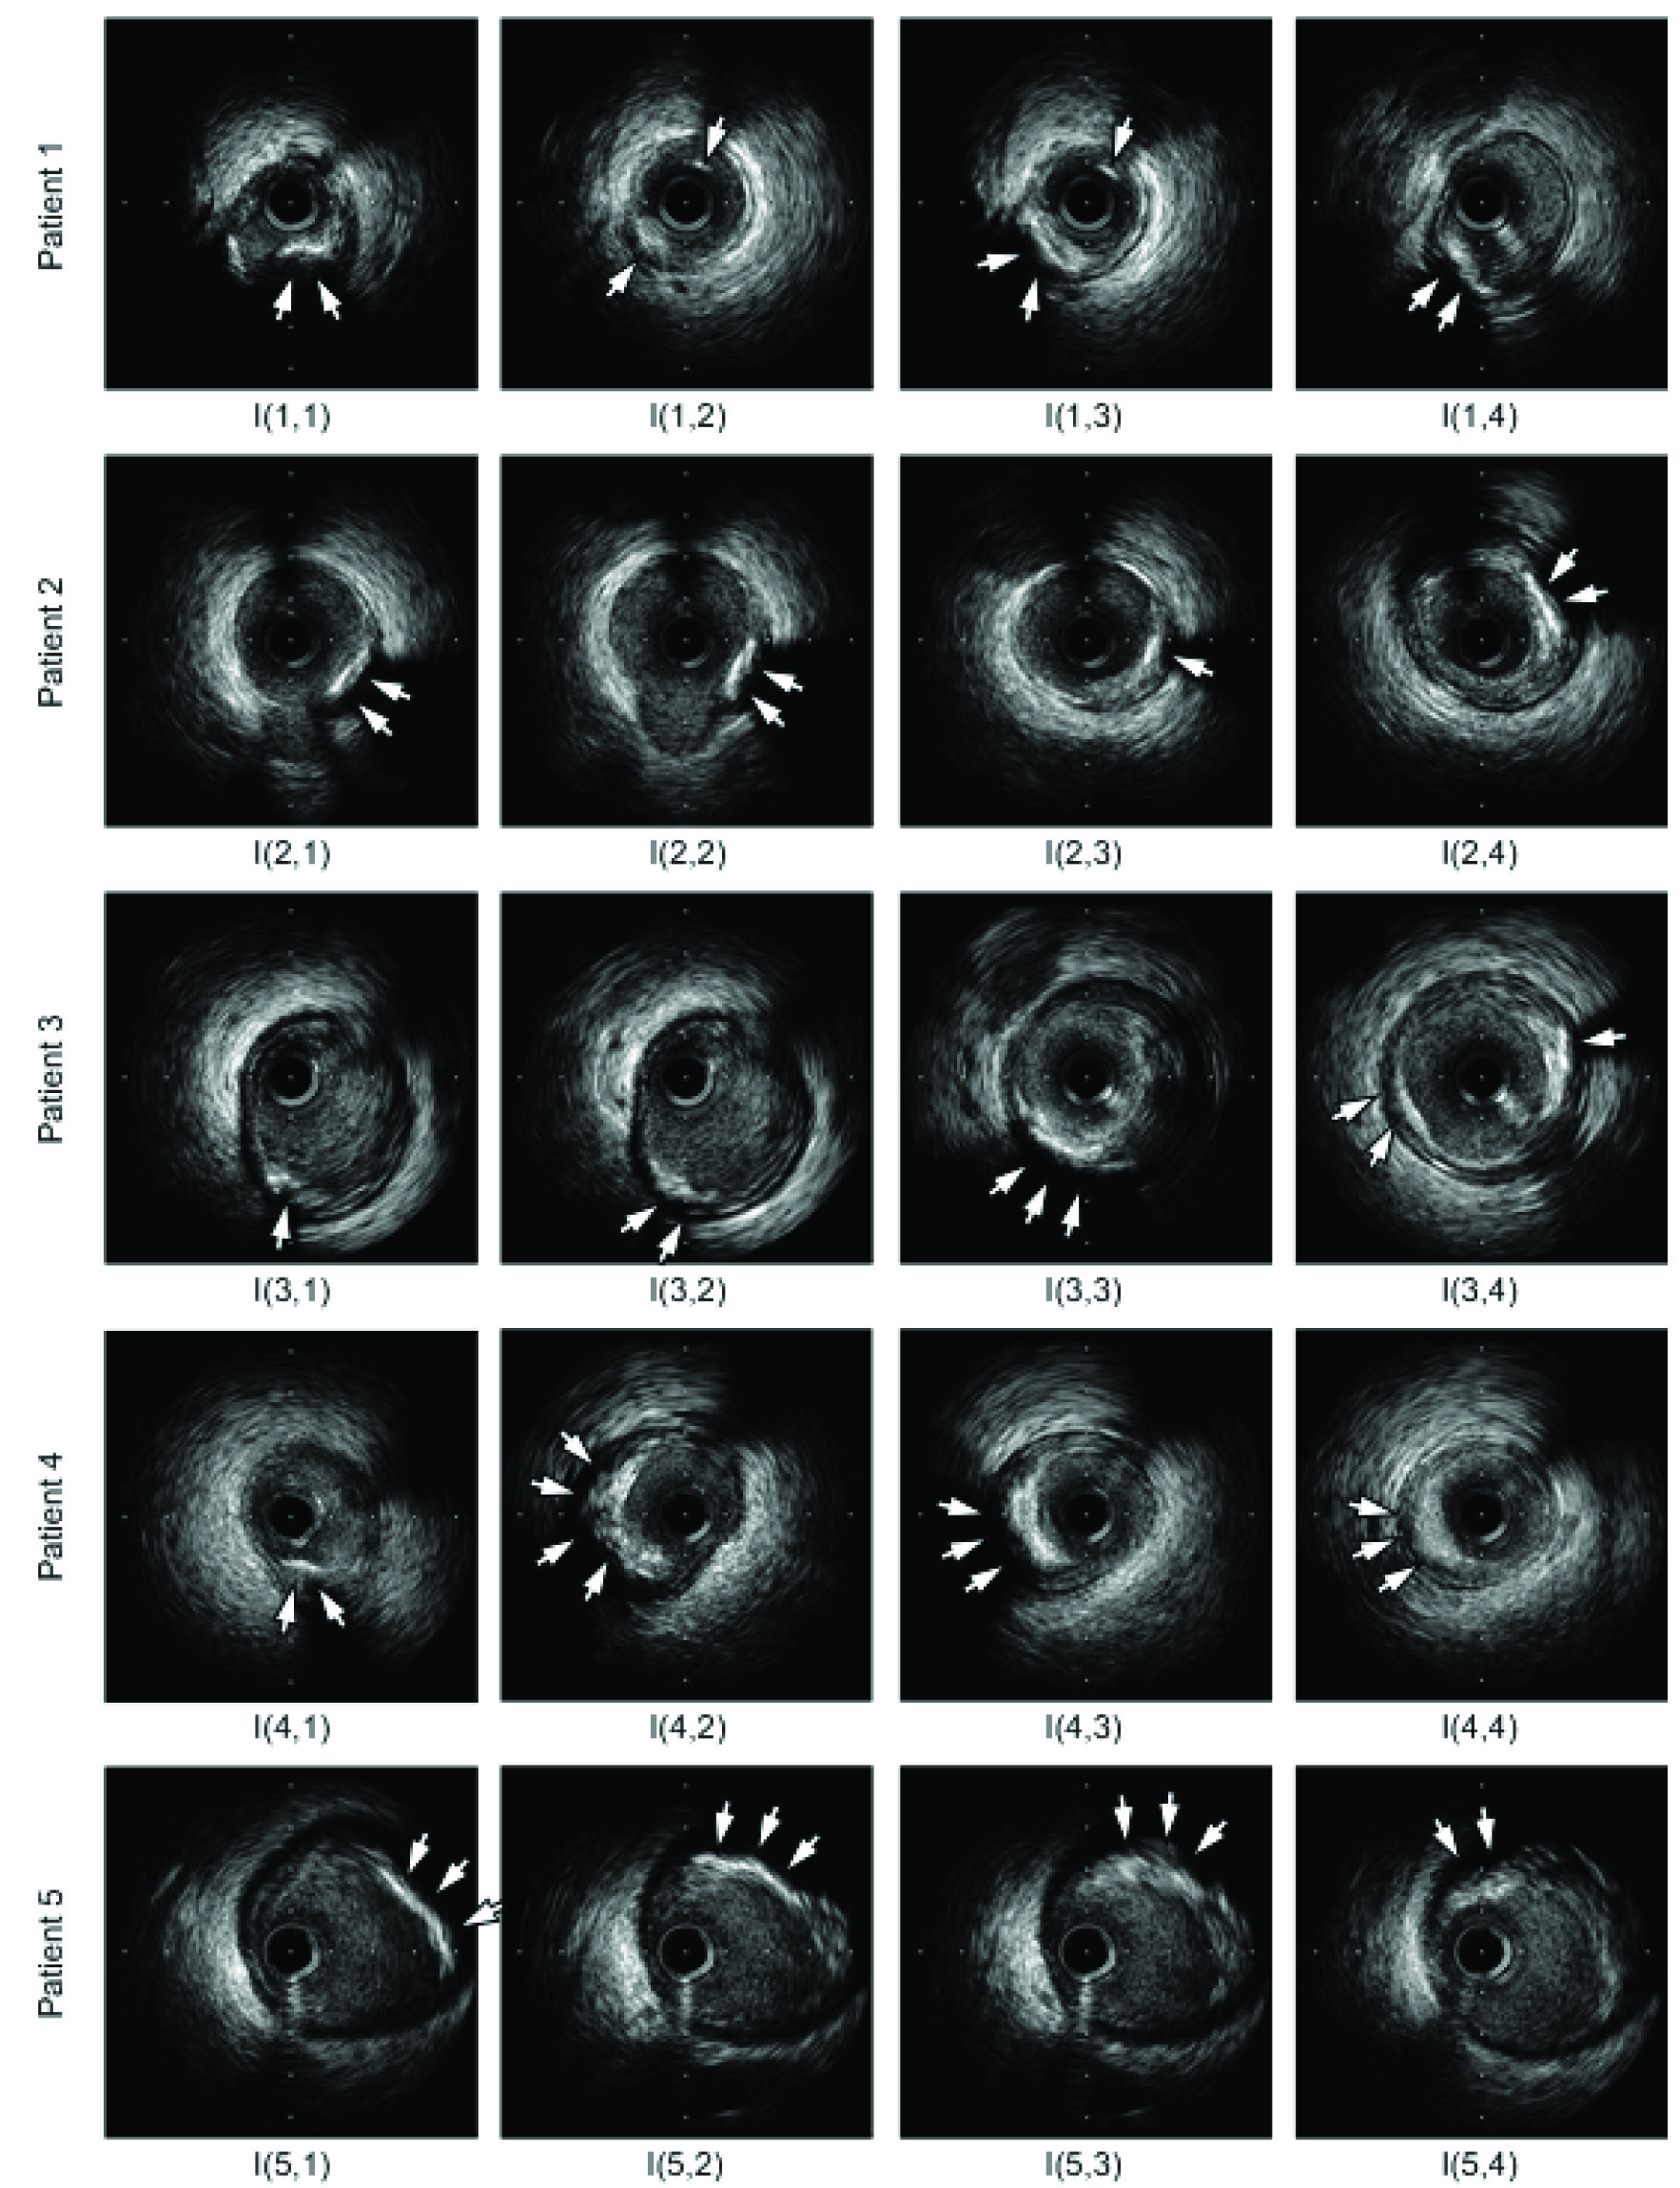
This study undertook a full ethics review by the Institutional Review Board of our institution and written informed consent is provided by all the patients. [Table/Fig-3] shows a typical example of five frames taken from six patients and arranged in a 5x4 matrix. This is represented as I(1,1)–I(5,4). The calcified plaques are indicated by the arrows. A 40 MHz IVUS catheter (Atlantis® SR Pro, Boston Scientific®) were used for data acquisition and the computer program MATLAB® (Math Works, Inc., Natick, MA) was used for the image analysis. Target lesions imaging were performed during automatic pullback of the catheter at a speed of 0.5 mm/second.
Sample IVUS frames I(1,1)–I(5,4) with a calcified plaque of five patients from the entire intravascular ultrasound (IVUS) videos.
Data Preparation
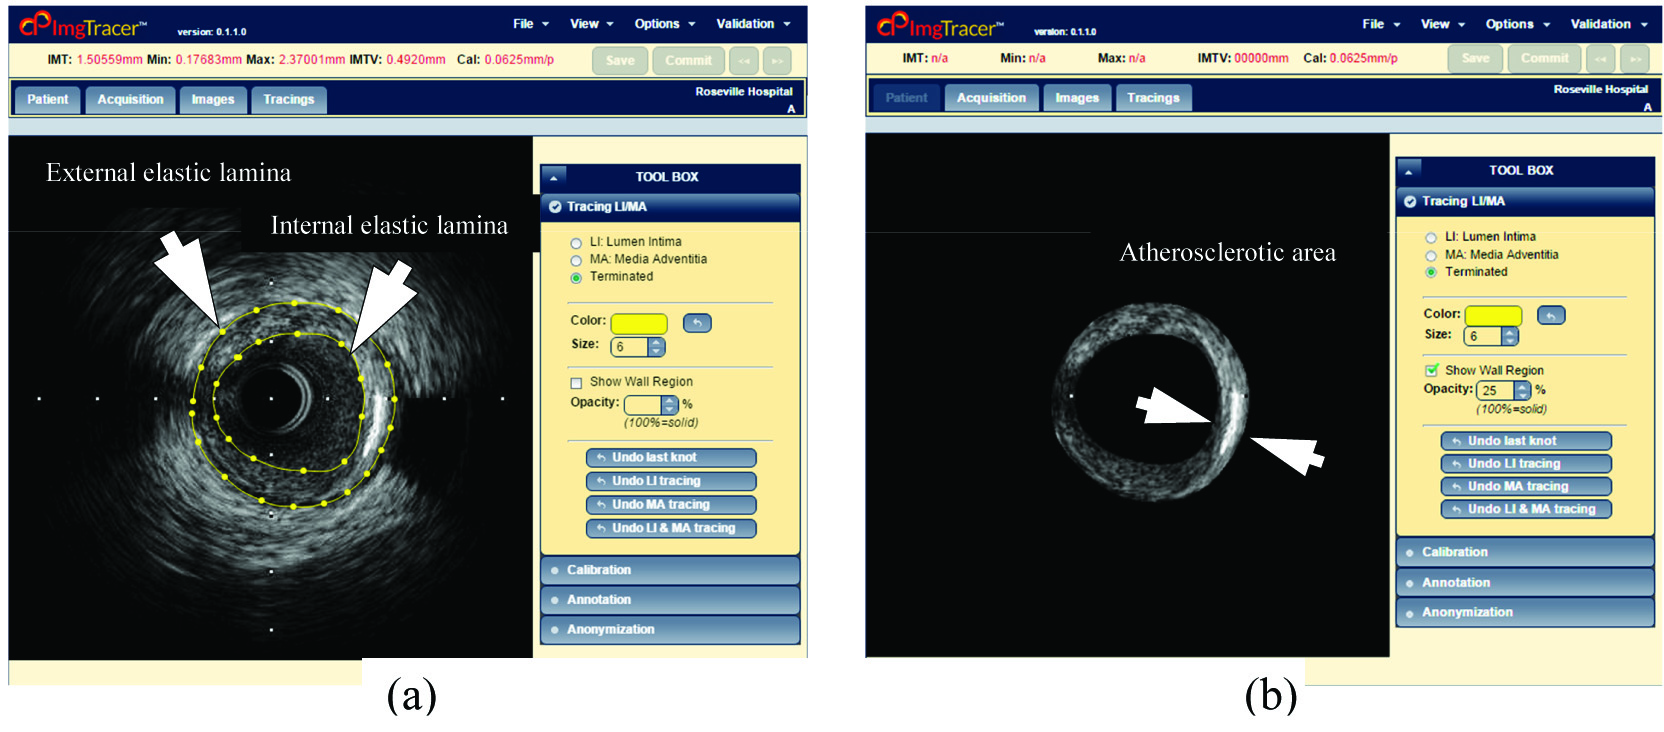
For extracting the vessel wall region, we have used the ImgTracer™ system (courtesy of AtheroPoint™, Roseville, CA, USA). The images were traced manually by two tracers; each traced about 20,045 frames, totaling 40,090 frames corresponding to 19 patients. The example of typical tracing is shown in [Table/Fig-4]. The inner yellow curve indicates the Internal Elastic Membrane (IEL) and outer yellow curve indicates the External Elastic Membrane (EEL) interface as shown in [Table/Fig-4a]. Now calcium can be extracted from the atherosclerotic area region as indicated in [Table/Fig-4b]. Equidistant spline fitting was used for smoothing the borders of the vessel wall region. Recently Araki T et al., [13] have used this software (ImgTracer™) to compute ground truth by manual tracing the lumen-intima interface or IEL and media-adventitia interface or EEL borders of coronary arteries.
(a) manual tracings (yellow) of the vessel wall region showing (internal elastic lamina) and outer borders (external elastic lamina) of the vessel wall region using ImgTracer™; (b) greyscale atherosclerotic area region image obtained from the input image (a) (Courtesy of AtheroPoint™, Roseville, CA, USA).
Coronary Calcium Volume Measurements
We have used a real-time automated system for the measurement of CCV given the borders of coronary vessel wall for all the frames of the intravascular ultrasound video. Four soft computing fuzzy classification techniques namely iterative thresholding (Santos), FCM, K-means, and HMRF were adopted. In this study, calcium volume is computed using conventional integration method which is like Simpson’s rule proposed by Scott [22].
Statistical Analysis
This paper examines the consistency, reliability, and accuracy of the system by performing the statistical tests (two-tailed paired Student’s t-test, Wilcoxon signed rank test, Mann-Whitney test, Chi-square test, Kolmogorov-Smirnov (KS) test). In the current study, all the statistical analyses were performed using MedCalc 16.0 software (Ostend, Belgium). All p-values less than 0.05 were considered statistically significant. We performed two-tailed paired Student’s t-test as we had less than 30 readings. The nonparametric Wilcoxon signed rank test subtracts the median of the values from the hypothetical population median. When the hypothetical population median is higher/lower, the result will be correspondingly positive/negative. Statistical significance between the results was further analysed using Mann-Whitney U test and Chi-square test. Lastly, the normality of each variable group was confirmed by Kolmogorov-Smirnov (KS) test.
Results
Automated Calcium Lesions Volume Measurement
[Table/Fig-5] shows the mean and standard deviation of computed calcium lesion volume using automated detection per frame followed by volume measurement using threshold-based, FCM, K-means, and HMRF methods. In our recent study led by Araki T et al., we had validated our soft computing methods (threshold-based, FCM, K-means, and HMRF) against an expert, trained in radiology/ ultrasound area [13]. This study clearly demonstrated an accuracy score of 92.08%, 89.24%, 92.80% and 82.4%, respectively for the above four soft computing methods. Based on this reliability and accuracy, the current study is focused on the relationship between these four soft computing calcium volume measurements against three manual coronary parameters namely: coronary vessel volume (mCVV), coronary lumen volume (mCLV), and coronary atheroma volume (mCAV) and the results are very encouraging.
Automated calcium lesion volumes using proposed methods.
| Segmentation Techniques | Mean Volume (mm3) | Standard Deviation (mm3) |
|---|
| Threshold-based | 38.02 | 18.68 |
| FCM | 40.85 | 20.93 |
| K-means | 29.79 | 13.32 |
| HMRF | 53.84 | 27.10 |
FCM: Fuzzy c-Means; HMRF: Hidden Markov Random Field
Correlation Between Manual and Automated Coronary Calcium Volumes
In this study, we have analysed CCV computed manually by an experienced cardiologist and automatically using four automated soft computing fuzzy segmentation techniques namely iterative thresholding (Santos), FCM, K-means, and HMRF.
We found a high correlation between mCVV, mCLV, and mCAV with aCCV. The correlations of aCCV with mCVV, mCLV, and mCAV for Santos calcium volume measurements were found: 0.51 (p=0.0264), 0.40 (p=0.0929), and 0.48 (p=0.0378) respectively. The correlations of aCCV with mCVV, mCLV, and mCAV for FCM calcium volume measurement technique were found: 0.52 (p=0.0239), 0.38 (p=0.1062), and 0.49 (p=0.0312), respectively. The correlations of aCCV with mCVV, mCLV, and mCAV for K-means calcium volume measurement technique were found: 0.56 (p=0.0126), 0.45 (p=0.0543), and 0.52 (p=0.0213), respectively. The correlations of aCCV with mCVV, mCLV, and mCAV for HMRF calcium volume measurement technique was found as 0.57 (p=0.0102), 0.42 (p=0.0758), and 0.56 (p=0.0136), respectively.
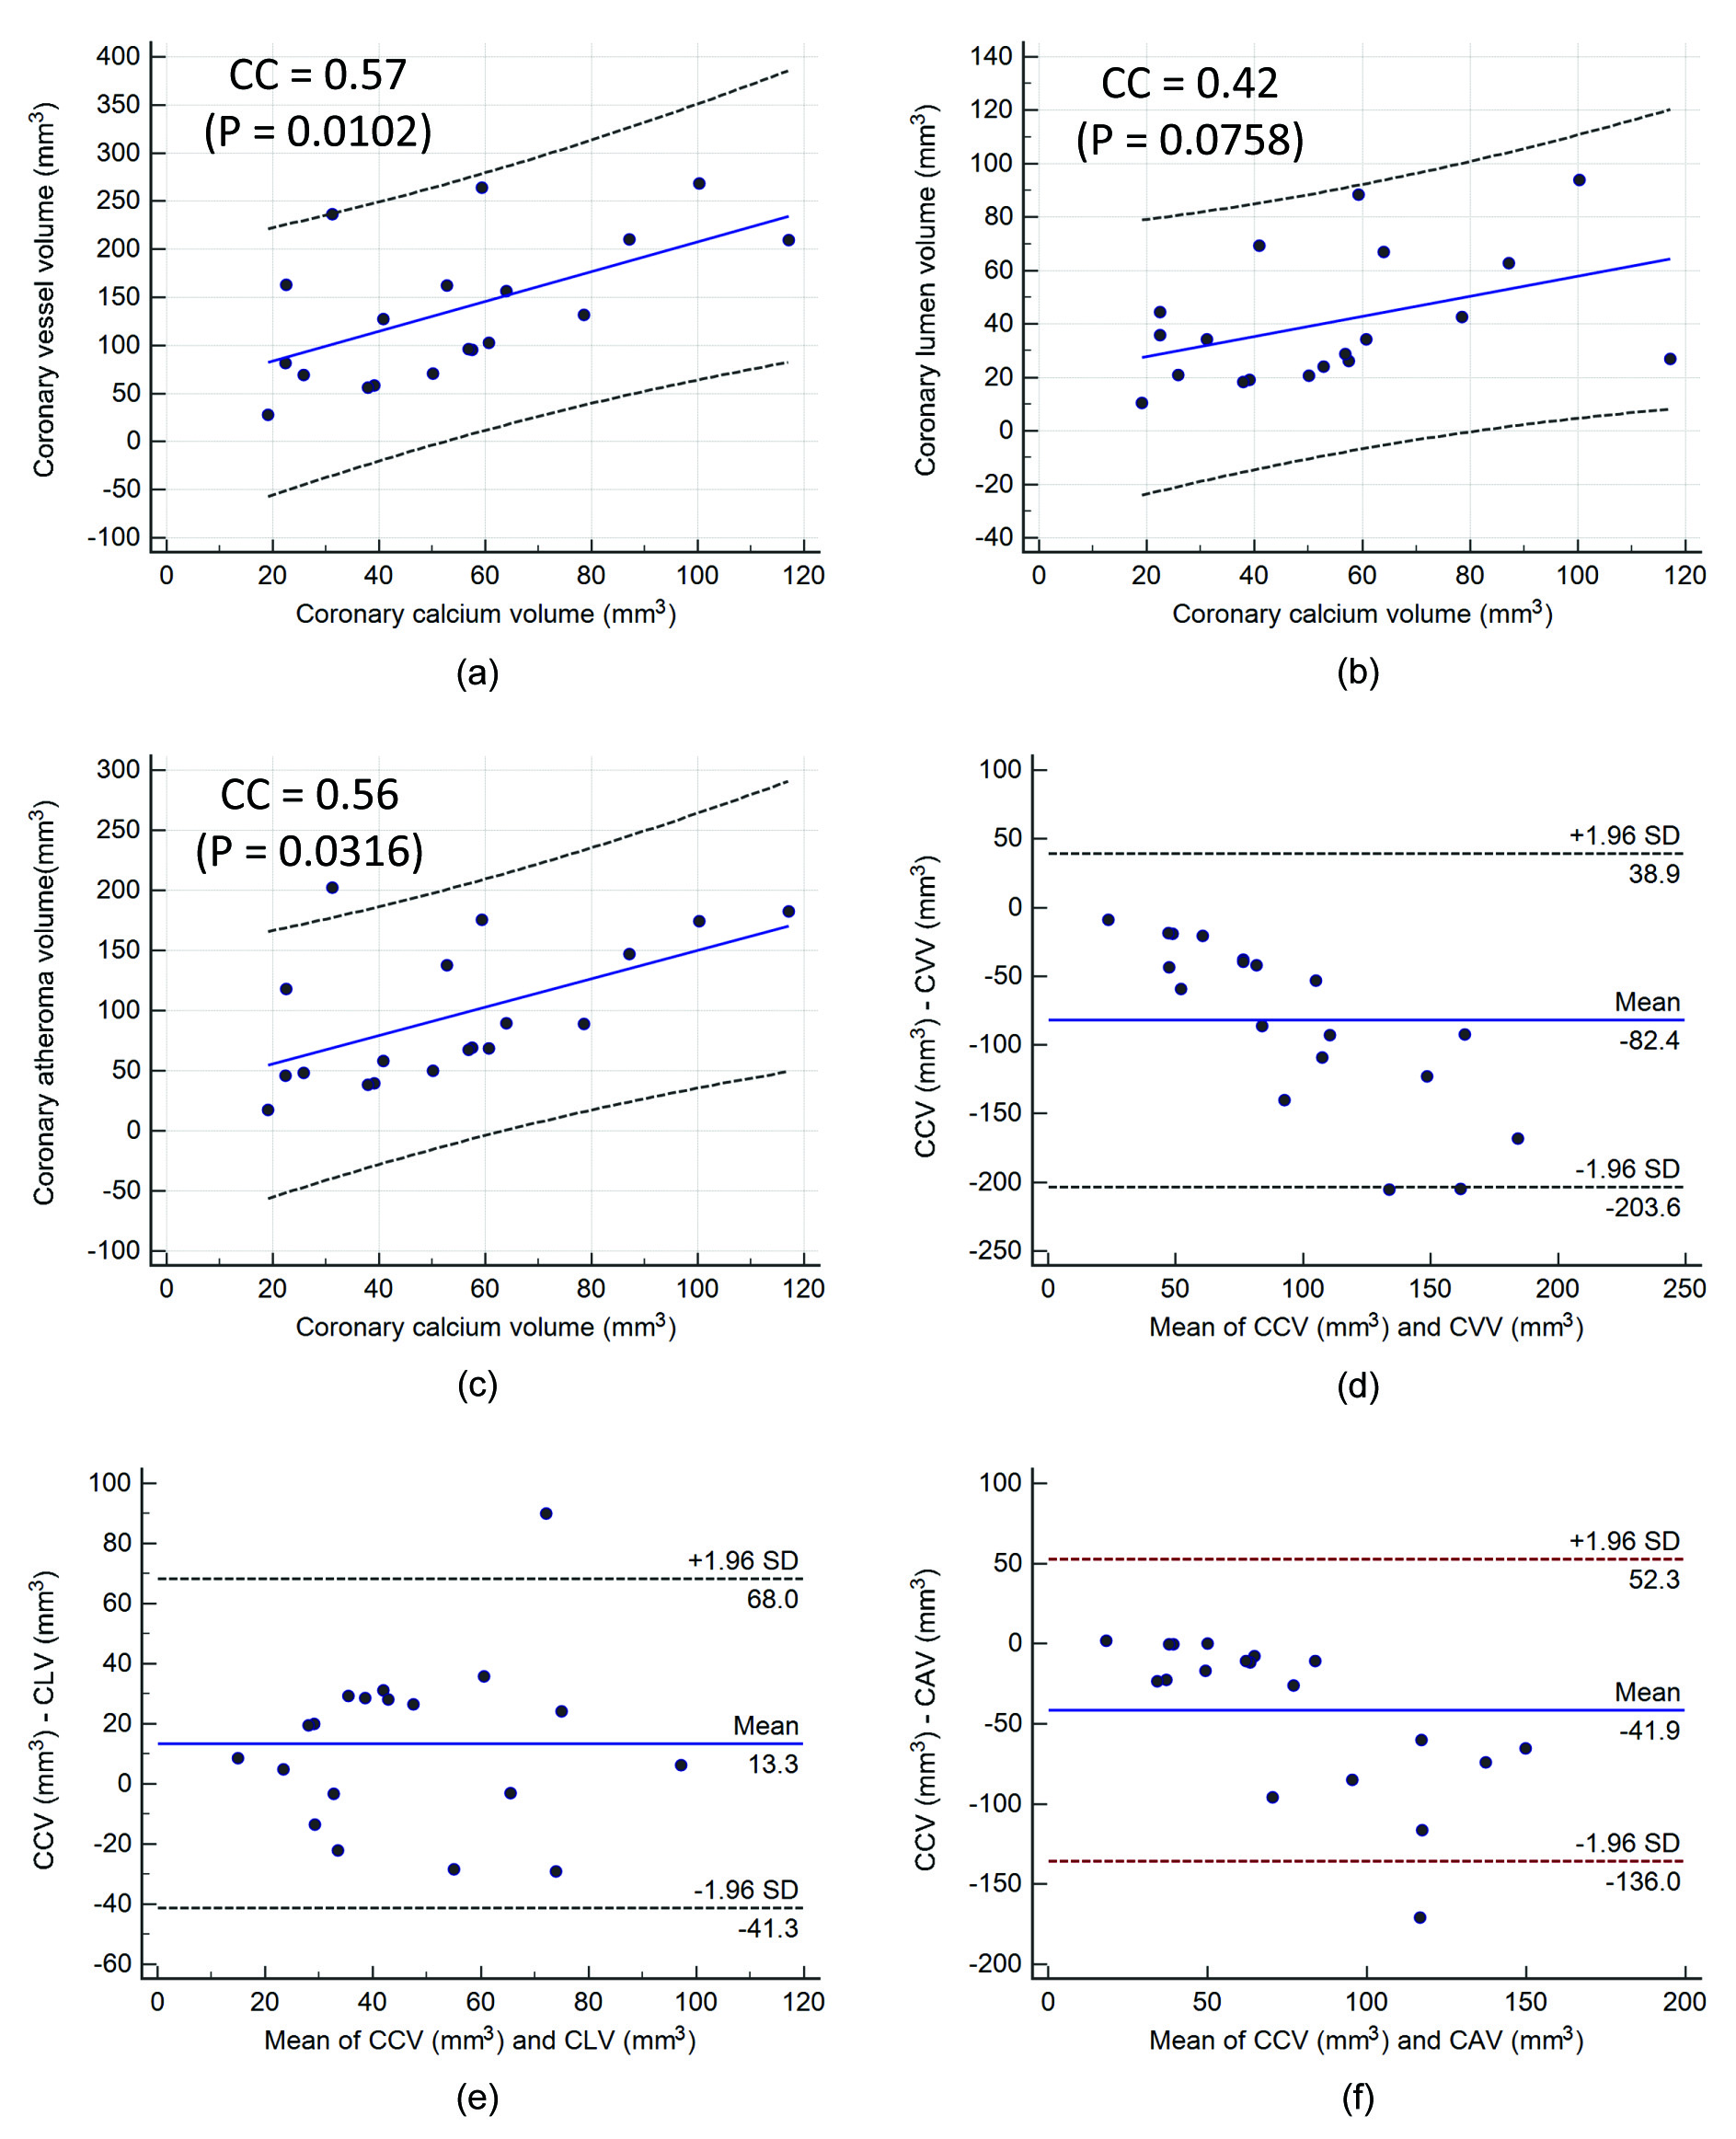
It is observed that the correlation of aCCV with mCVV, mCLV, and mCAV for HMRF was higher compared to all the other three (Santos, FCM, and K-means) calcium volume measurement. For all the four calcium volume measurement techniques, correlation of aCCV with mCVV was higher. The scatter diagrams of aCCV vs. mCVV, mCLV, and mCAV using HMRF calcium volume measurement is shown in [Table/Fig-6a-c], respectively. The corresponding Bland-Altman plot of the above relationships is shown in [Table/Fig-6d-f]. Bland-Altman plots [23] exhibit the average of the differences of two CCV. It can be observed that the bias is higher in the negative difference direction which indicates that aCCV readings are slightly higher than the manual mCVV, mCLV, and mCAV readings.
Scatter diagram showing a high correlation between: (a) coronary calcium volume and coronary vessel volume; (b) coronary calcium volume and coronary lumen volume; (c) coronary calcium volume and coronary atheroma volume. Bland-Altman plot of coronary calcium volume against three expert readings; (d) coronary vessel volume; (e) coronary lumen volume; (f) coronary atheroma volume.
This paper examines the consistency, reliability, and accuracy of the system by performing the statistical test. The two-tailed paired Student’s t-test, Wilcoxon signed rank test [24], Mann-Whitney test, and Chi-square test is performed and the statistical results are shown in [Table/Fig-7].
Statistical tests between automated coronary calcium volumes against manual readings.
| Segmentation Techniques | Manual Reading using iMAP software | Two-tailed paired Student’s t-test | Wilcoxon signed rank test | Mann-Whitney test | Chi-squared test |
|---|
| t | p | p | p | Contingency coefficient | p |
|---|
| Threshold-based | aCCV and mCVV | 6.502 | <0.0001 | <0.0001 | <0.0001 | 0.973 | =0.2356 |
| aCCV and mCLV | 0.447 | =0.6602 | =0.9843 | =0.9418 | 0.973 | =0.2356 |
| aCCV and mCAV | 4.908 | =0.0001 | <0.0001 | =0.0002 | 0.973 | =0.2356 |
| FCM | aCCV and mCVV | 6.389 | <0.0001 | <0.0001 | <0.0001 | 0.973 | =0.2356 |
| aCCV and mCLV | -0.062 | =0.9515 | =0.9530 | =0.8153 | 0.973 | =0.2356 |
| aCCV and mCAV | 4.733 | =0.0002 | <0.0001 | =0.0008 | 0.973 | =0.2356 |
| K-means | aCCV and mCVV | 6.947 | <0.0001 | <0.0001 | <0.0001 | 0.973 | =0.2356 |
| aCCV and mCLV | 2.126 | =0.0476 | =0.1447 | =0.3000 | 0.973 | =0.2356 |
| aCCV and mCAV | 5.550 | <0.0001 | <0.0001 | <0.0001 | 0.973 | =0.2356 |
| HMRF | aCCV and mCVV | 5.802 | <0.0001 | <0.0001 | =0.0001 | 0.973 | =0.2356 |
| aCCV and mCLV | -2.085 | =0.0516 | =0.0494 | =0.1116 | 0.973 | =0.2356 |
| aCCV and mCAV | 3.797 | =0.0013 | <0.0001 | =0.0173 | 0.973 | =0.2356 |
Correlation of Haemoglobin (HbA1c) with Age
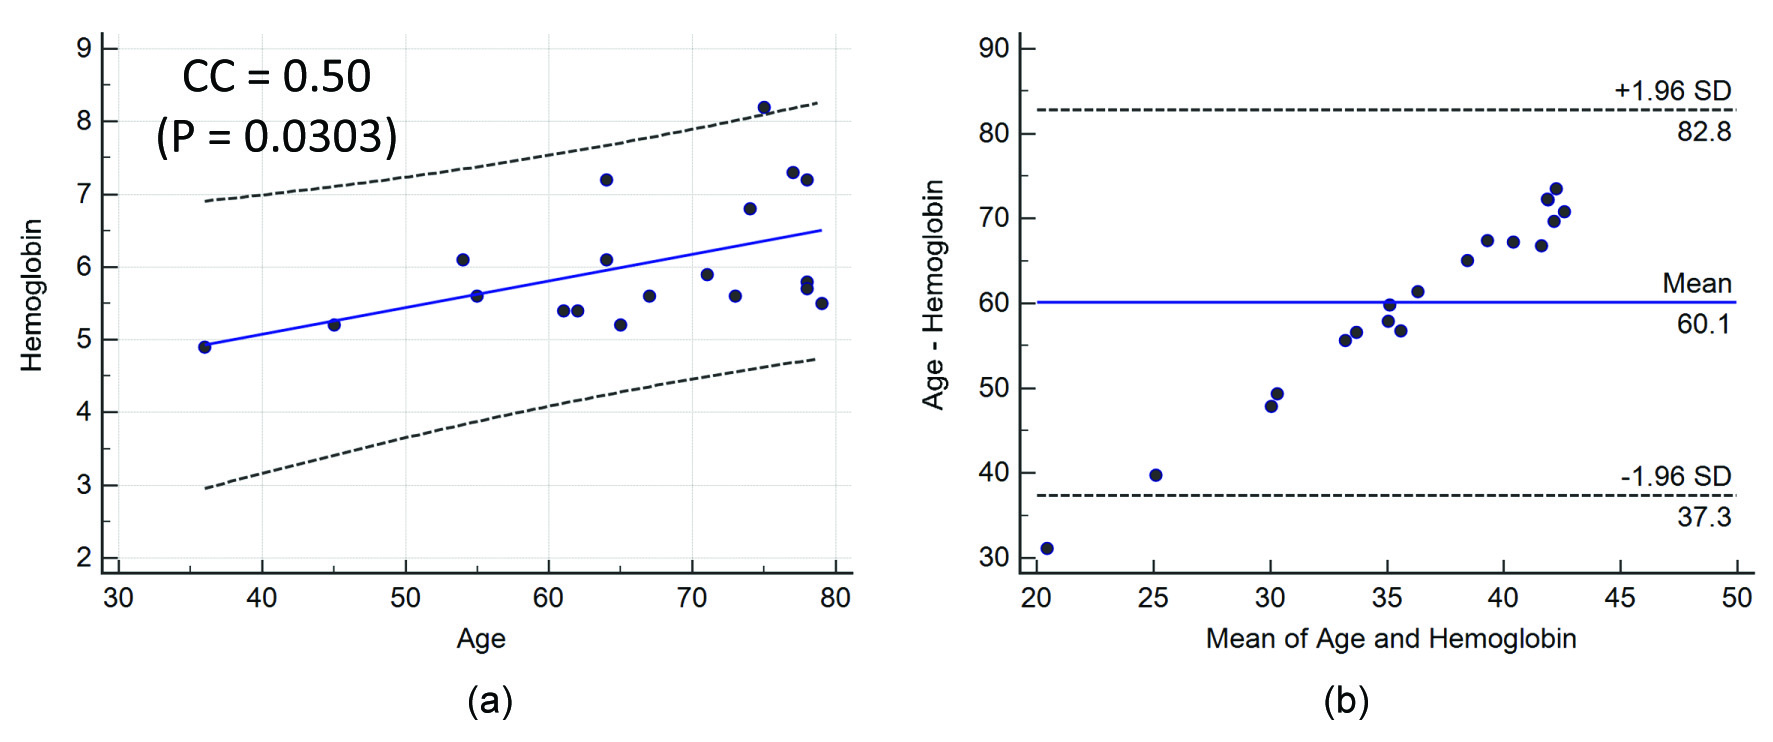
In this study, we have also analysed the correlation of haemoglobin with age. The correlation coefficient of haemoglobin with respect to age was moderate: 0.50 (p=0.0303). The scatter diagram of age with haemoglobin is shown in [Table/Fig-8a]. Bland-Altman plot of haemoglobin with age is given in [Table/Fig-8b] which shows the average bias, or the average of the differences of two quantities.
(a) Scatter diagram showing the positive correlation between haemoglobin and age; (b) Bland-Altman plot of haemoglobin and age.
Discussion
As the growth of calcified plaque in the coronary vessel wall is multi-focal and irregular [22,25], it is required to process the entire frames all along the coronary artery for calcium volume estimation. In this study, we have used four fully automated techniques based on the threshold (Santos), FCM, K-means, and HMRF for calcium detection and volume computation [26]. Even though, the core segmentation methods and the concept of calcium volume estimation on entire coronary artery video is already published previously by Araki [13], the concept of establishing a relation between these four automated CCV and three manual reading namely: mCVV, mCLV, and mCAV are innovative.
In our study, we found a high correlation between aCCV and manual coronary vessel, lumen, and atheroma volumes. While others have done only manual readings comparisons [17-19], our study has automatized the process by automatically computing the calcium volume in the entire coronary artery using IVUS videos.
A review of previous studies is summarized in [Table/Fig-9]. Mintz GS et al., worked on the relationship between IVUS calcium lesion and lesion severity in X-ray coronary angiography [17]. The authors measured the lumen diameter in diastole before intervention using an automated edge detection method. The IVUS study was performed using the commercially available systems. They showed a moderate correlation between; cross-sectional narrowing in IVUS compared to the diameter narrowing in coronary angiography. Large cross-sectional narrowing in coronary arteries was observed due to a large calcium deposition, thereby increasing the atheroma area. We observed a similar relationship demonstrating an increase in coronary atheroma volume due to increase in CCV in our study.
Survey on calcium detection techniques and volume measurements.
| Authors | N | F/video | calcium detection | Statistical analysis | Analysis done on video | Calcium volume computation |
|---|
| Mintz GS et al., [17] | 1442 | 1043 frames | Semi-automated | CC, ANOVA | None | None |
| Sangiorgi G et al., [19] | 13 | 723 frames | Manual | CC | None | None |
| Proposed | 19 | ≈ 40,090 frames (≈ 2,110 frames per video) | Automated | CC, Bland-Altman, Student t-test, Wilcoxon test, Mann-Whitney test, and Chi-square test | Yes | Yes |
N: Number of patients, F: Frames, CC: Correlation coefficient.
Mintz GS et al., studied the effects of arterial remodeling on the coronary artery stenosis [18]. The authors analysed IVUS target lesion and proximal reference segment (i.e., a most normal-looking cross section within 10 mm proximal to the lesion but distal to any side branch). The coronary lesion-site/reference-site ratio was then related to lumen diameter obtained using angiography. This study examined 603 nonostial coronary artery stenosis with chronic stable angina. The authors also observed a high correlation between angiographic lumen diameter stenosis and the ratio of IVUS lesion/ reference segments vessel areas. Angiographic lumen diameter stenosis is caused due to an increase in calcium deposition. Thus, we can assume that an increase in calcium has a high correlation with the increase in vessel area that supports our assumption.
A detailed histopathology study was performed by Sangiorgi G et al., [19], where the authors exploring the relationship between coronary calcification and atherosclerotic plaque burden. This study was conducted in 13 patients and calcium area was computed using microradiography images. They showed a high correlation between patient’s age against coronary plaque area and coronary calcium area. The study consisted of the following analysis: (i) complete coronary artery; (ii) individual coronary artery (LAD, LCX, and RCA); and (iii) individual coronary segments. For individual coronary segments, the complete coronary artery was sectioned at 3 mm intervals. For all the three above mentioned methods, their study suggested a mild correlation r=0.48 between coronary lumen area and coronary calcium area. Above results support our hypothesis of a moderate correlation between mCLV and aCCV measurements.
Our hypothesis of the high correlation of automated coronary calcium with the manual coronary vessel, lumen, and atheroma volume is also supported by the Glagov S et al., phenomenon [27]. The phenomenon suggests that in atherosclerotic human coronary arteries, lumen area remained constant until the percent stenosis exceeded 40% [28]. Saba L et al., evaluated the association of automated cIMT with HbA1c for CAD in a Japanese cohort [29]. An analysis was done on 370 patients and results clearly established a direct correlation (p=0.0007) between HbA1c and automated cIMT measurements. Hanafusa N et al., studied the relationship between HbA1c levels with mortality nonelderly populations experience poor prognosis with haemoglobin <10 g/dl, while elderly population only with haemoglobin <9 g/dl [30]. For both haemoglobin strata <9, ≥9, <10 g/dl, significant interactions were observed between age and haemoglobin. Results of our clinical relationship between age and haemoglobin are along the same lines as previous research.
The above relations can be used as a biomarker for detecting CAD and as a primary sign for recognizing patients with atherosclerotic plaques. The main strength of our techniques is the ability to automatically extract multi-focal calcium for volume measurement in the full coronary artery by utilizing the entire IVUS video. Second, we automatically computed the calcium lesion volume based on fuzzy pixel classification technique and benchmarking against the threshold-based method. Third, our results followed our assumptions and hypothesis.
Limitation
Even though, the number of patients utilized was not very large (19 patients), the numbers of frames used were 40,090, which is an equally large number to justify the strength of the system. Our future objective is to add more patients in the study to further validate our hypothesis in different sets of populations but the current results are truly encouraging.
Conclusion
We demonstrated four pixel classification methods for measuring the calcium volume and comparing against the three manual readings: mCVV, mCLV, and mCAV. A moderately higher CC was observed between HMRF and corresponding three manual methods and hence, aCCV measurement using HMRF method is more accurate. The relationship of aCCV with mCVV, mCLV, and mCAV can be used as a primary sign of CAD during atherosclerosis and can offer a means of recognizing patients at utmost risk for cardiovascular proceedings and in need of more severe treatments. We also observe a positive CC between age and haemoglobin which confirms higher risk of CVD with an increase in age.
Conflict of interest: Dr. Jasjit S. Suri has a relationship with AtheroPoint™, Roseville, CA, USA which is dedicated to Atherosclerosis Disease Management, including Cerebrovascular and Cardiovascular imaging.
N: Number of patients, F: Frames, CC: Correlation coefficient.