NMSC, consisting of BCC and SCC, is 18-20 times more frequent than cutaneous malignant melanoma [1]. According to The Egyptian Pathology-Based Cancer Registry (2001-2010), NMSC in Egypt represented 4.4% of total malignancies [2].
Hypoxia plays a vital role in carcinogenesis. In tumour microenvironment, metabolic reprogramming and changes in gene expression are necessary for adaptation to decreased oxygen availability. HIFs being oxygen sensitive transcription factors help in adaptation to hypoxic environment. They are important mediators of cellular response to stress. Metabolic changes occurring during tumourigenesis are, in part, under hypoxia and HIFs regulation. Moreover, inflammatory signaling and infiltration secondary to hypoxia are clear drivers of tumour progression [3].
HIF-1 is the intrinsic survival factor of tumour cells to overcome oxygen and nutrient deficits during proliferation and progression [4] through mediation of the transcription of over 200 target genes, including genes of Vascular Endothelial Growth Factor (VEGF) and GLUT-1 [5]. It induces expression of target genes by DNA binding in the area of Hypoxia Response Element (HRE) which gives rise to a series of subsequent processes like inhibition of apoptosis, switch to anaerobic metabolism, angiogenesis, cell proliferation and erythropoiesis, all of which stimulate carcinogenesis and metastasis [6].
HIF-1 is a heterodimeric protein consisting of a constitutively expressed β-subunit (HIF-1β) and α-subunit (HIF-1α). Under hypoxia, HIF-1α is stabilized and dimerizes with HIF-1β interacting with the co-activator CBP/p300 to bind to the HRE on the promoter regions in various target genes [7,8].
GLUT-1 is the most common glucose transporter in humans. It facilitates the transport of glucose across the plasma membranes of mammalian cells [9] and is responsible for the low level of basal glucose uptake required to sustain respiration in all cells [10]. Previous studies indicated that upregulation of GLUT-1 contributed to improve glucose metabolism in rapidly proliferating cancer cells [9], which are energy-dependent [11].
This study aimed at evaluating the pattern and distribution of HIF-1α and GLUT-1 expression in NMSC and their relationship with clinicopathologic parameters of selected cases.
Materials and Methods
This case-control study included 60 subjects (20 cases with nodular BCC, 20 cases with cutaneous SCC and 20 age and sex-matched healthy subjects as a control group). Cases of BCC and SCC were selected from Dermatology Outpatient Clinic, Menoufiya University Hospital, Egypt during the period from March 2014 to March 2015. For the retrospective part of the study, tissue blocks of archived cases in Pathology Department, Menoufiya University were used. Normal skin samples were obtained from subjects attending Plastic Surgery Department. Biopsies from cases and control subjects were site-matched. Clinical data describing patients’ demographics (age and gender) as well as the clinical variables (site, size of lesions and disease duration) were obtained and documented.
Ethics
A written consent form approved by The Local Ethical Research Committee in Menoufia Faculty of Medicine was obtained from every subject before the study initiation. This was also in accordance with the Helsinki Declaration of 1975 (revised in 2000).
Histopathological Examination of H&E Stained Sections was done for
a) BCC: Histopathological types and status of the surgical margins;
b) SCC: Grading according to Broder’s classification [12], Staging according TNM staging system [13], status of the surgical margins and status of the lymph nodes.
Immunohistochemical (IHC) Staining for HIF-1α and GLUT-1
Sections were cut from the paraffin-embedded blocks were stained with both rabbit monoclonal antibody (Cat.# CME349 A,B) raised against HIF-1α which was received as concentrated 0.1mL (BIOCARE MEDICAL, LLC. 4040 Pike Lane Concord, CA 94520 USA) and with rabbit polyclonal antibody (Cat. #RB-9052-R7) raised against GLUT-1. It was received as 7.0 mL ready to use (Lab Vision Corporation 46360 Fermont Blvd. Fermont, CA 94538-6406, USA). Procedure of IHC staining was done according to received datasheet of the used antibodies.
Interpretation of HIF-1αand GLUT-1 Immunostaining
HIF-1α expression was confirmed by cytoplasmic and/or nuclear stain in examined cells [14]. GLUT-1 expression was confirmed by membranous staining, sometimes with cytoplasmic staining [15]. Erythrocyte positivity was considered as internal positive control for GLUT-1 [16].
For every antibody, the following items were assessed:
1- The epidermis of normal skin biopsies, and the overlying epidermis in BCC and SCC were assessed for:
a) Expression: positive or negative
b) Percentage of positive cells: assessed at 200X magnification field [17]:
c) Histoscore (H score): H score was calculated to all studied cases according to equation:
H score = 1x% of mildly stained cells, + 2x% moderately stained cells, + 3x% of strongly stained cells.
d) Distribution: patchy or diffuse;
e) Pattern: cytoplasmic, membranous or membrano-cytoplasmic (for GLUT-1) or cytoplasmic or nuclear (for HIF-1α);
f) Type of the stained epidermal cells: basal or basal and suprabasal;
2- Tumour islands in BCC and SCC were assessed for:
a) Expression: positive or negative;
b) Percentage of positive cells: assessed at 200X magnification field;
c) Histo-score (H score) [18];
d) Distribution: patchy or diffuse;
e) Pattern;
f) Localization: peripheral, central, or central and peripheral immunoreactivity;
3- The dermis of normal skin biopsies, and stroma of BCC and SCC were assessed for the following:
a) Expression: positive or negative;
b) Type of stained dermal cells: inflammatory or adnexa;
Statistical Analysis
Data were collected, tabulated and statistically analyzed using a personal computer with “(SPSS) version 11.0” program (SPSS Inc, Chicago, Illinois, USA). Values were expressed in number, percentage, mean±standard deviation (X±SD) when appropriate. Fisher’s-exact test, Chi-square test (χ2), Mann-Whitney U test, Spearman’s coefficient were used. Differences were considered statistically significant with p< 0.05.
Results
Clinical and histopathological data of the studied cases are summarized in [Table/Fig-1].
Clinical and histopathological characteristics of the studied NMSC cases.
| Variable | BCC No = 20 | SCC NO = 20 |
|---|
| Age (years)X±SD | 61.7±9.96 | 62.30±12.36 |
| Duration (months)X±SD | 10.67±3.42 | 7.82±2.13 |
| Size (cm)X±SD | 1.67±0.68 | 3.43±2.09 |
| GenderMales Females | No (%)5 (25)15 (75) | No (%)8 (40)12 (60) |
| SiteFace and scalp ExtremitiesVulva | 20 (100)0 (0)0 (0) | 8 (40)5 (25)7 (35) |
| Clinical TypesNodulo-ulcerative | 20(100) | -- |
| Surgical MarginsInvolved Free | 8 (40)12 (60) | 10 (50)10 (50) |
| Histologic gradeI IIIII | -- | 7 (35) 10 (50)3 (15) |
| Histologic types | Solid 18 (90)Adenoid 1 (5)keratotic 1 (5) | Conventional 15 (75) Sarcomatoid 5 (25) |
| StagingEarly stageLate stage | -- | 13 (65)7 (35) |
| Lymph nodesInvolvedNot involved | -- | 9 (45)11 (55) |
Immunohistochemical expression of HIF-1α and GLUT-1 in studied groups: Expression of HIF-1a and GLUT-1 as shown in [Table/Fig-2,3,4,5,6,7,8 and 9].
Comparison between the studied groups regarding HIF-1α expression.
| Variable | BCC N = 20 | SCC N=20 | Normal skin N=20 | p-value |
|---|
| No | % | No | % | No | % |
|---|
| Overlying epidermis |
| ExpressionPositiveNegative | 191 | 955 | 164 | 8020 | 18 2 | 9010 | p1 = 1.0p2=0.66p3=1.0p4=0.34 |
| DistributionPatchyDiffuse | 109 | 52.647.4 | 412 | 2575 | 144 | 77.822.2 | p1=0.11p2=0.002p3=0.009p4=0.1 |
| PatternCytoplasmicNuclear Nucleo- cytoplasmic | 0217 | 010.589.5 | 0016 | 00100 | 6012 | 33.3066.7 | p1=0.01p2=0.02p3=0.001p4=0.49 |
| LocalizationBasalAll layers | 217 | 10.589.5 | 016 | 0100 | 018 | 0100 | p1=0.49p2=NAp3=0.54p4=0.49 |
| PercentX±SDRange | 62.89±25.5110 – 90 | 80.0±13.2950 – 95 | 13.33±6.4210 – 30 | p1<0.001p2<0.001p3<0.001p4=0.02 |
| Η scoreX±SDRange | 168.16±93.3710 – 270 | 240.0±39.87150 – 285 | 18.33±16.45 10 – 60 | p1<0.001p2<0.001p3<0.001p4=0.01 |
| Tumour islands |
| ExpressionPositiveNegative | 713 | 3565 | 200 | 1000 | 182 | 9010 | p1<0.001p2=0.49p3=0.06p4<0.001 |
| DistributionPatchyDiffuse | 70 | 1000 | 614 | 3070 | 144 | 77.822.2 | p1=0.29p2=0.003p3=0.04p4=0.002 |
| PatternCytoplasmicNuclearNucleo– cytoplasmic | 00 7 | 00100 | 0515 | 02575 | 6012 | 33.3066.7 | p1=0.14p2=0.008p3=0.003p4=0.55 |
| LocalizationCentral PeripheralCentral and peripheral | 610 | 85.714.30 | 1307 | 65035 | ------- | ---- | p4=0.006 |
| PercentX±SDRange | 18.57±4.7610 – 25 | 61.5±22.0720 – 90 | 13.33±6.4210 – 30 | p1=0.02p2<0.001 p3<0.001p4<0.001 |
| Η scoreX±SDRange | 52.86±15.2430 – 75 | 184.5±66.2160 – 270 | 18.33±16.4510 – 60 | p1=0.001p2<0.001p3<0.001p4<0.001 |
| Stroma |
| ExpressionPositiveNegative | 200 | 1000 | 200 | 1000 | 020 | 0100 | p1<0.001p2<0.001p3<0.001p4=NA |
| TypeInflammatory AdnexaAdnexa and inflammatory | 2513 | 102565 | 1406 | 70030 | 000 | 000 | p1<0.001p2<0.001p3<0.001p4=0.49 |
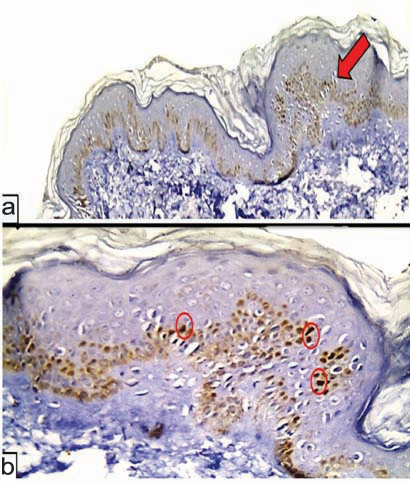
(a) HIF-1α in normal skin in the basal and suprabasal layers of the epidermis (red arrow) (Immunoperoxidase X40); (b) higher power showing nuclear patchy expression of HIF-1α (red circles) in epidermis with negative dermal immunoreactivity (Immunoperoxidase X400).
Comparison between the studied groups regarding GLUT-1 expression.
| Variable | BCC n = 20 | SCC N=20 | Normal skin N=20 | p-value |
|---|
| No | % | No | % | No | % | |
|---|
| Overlying epidermis |
| ExpressionPositiveNegative | 200 | 1000 | 200 | 1000 | 200 | 1000.0 | p1=NAp2=NAp3=NAp4=0.41 |
| DistributionPatchyDiffuse | 126 | 66.733.3 | 96 | 6040 | 416 | 2080 | p1=0.004p2=0.01p3=0.02p4=0.69 |
| PatternCytoplasmicMembranousMembrano- cytoplasmic | 0162 | 088,911.1 | 0123 | 08020 | 4016 | 20080 | p1<0.001p2<0.001p3<0.001p4=0.49 |
| LocalizationBasalAll layers | 810 | 44.455.6 | 87 | 53.346.7 | 020 | 0100 | p1=0.001p2<0.001p3<0.001p4=0.61 |
| PercentX±SDRange | 35.56±9.8310 - 50 | 42.0±16.5620 - 90 | 58.75±19.5920 - 85 | p1<0.001p2=0.01p3<0.001p4=0.3 |
| H scoreX±SDRange | 90.55±31.3410 - 150 | 109.33±48.9160 - 240 | 133.25±78.9120 - 215 | p1=0.09p=20.41p3=0.13p4=0.3 |
| Tumour islands |
| ExpressionPositiveNegative | 146 | 7030 | 200 | 1000.0 | 200 | 1000.0 | p1=0.02p2=NAp3=0.17p4=0.02 |
| DistributionPatchyDiffuse | 140 | 1000.0 | 218 | 1090 | 416 | 2080 | p1<0.001p2=0.66p3=0.04p4<0.001 |
| Pattern CytoplasmicMembranousMembrano- cytoplasmic | 068 | 042.957.1 | 0173 | 08515 | 4016 | 20080 | p1=0.003p2<0.001p3<0.001p4=0.01 |
| LocalizationCentral PeripheralCentral and peripheral | 1211 | 85.77.17.1 | 0173 | 08515 | ------ | ---- | p4<0.001 |
| PercentX±SDRange | 29.28±9.9710 - 40 | 53.0±12.1830 - 70 | 58.75±19.5920 - 85 | p1<0.001p2=0.15p3=0.004p4<0.001 |
| H scoreX±SDRange | 82.14±34.4610 - 120 | 144.0±45.060 - 210 | 133.25±78.9120 - 215 | p1=0.09p2=0.98p3=0.39p4<0.001 |
| Stroma |
| ExpressionPositiveNegative | 200 | 1000 | 200 | 1000 | 182 | 9010 | p1=0.49p2=0.49p3=0.04p4=NA |
| TypeInflammatoryAdnexaAdnexa and inflammatory | 1901 | 9505 | 1712 | 85510 | 1800 | 9000 | p1=1.0p2=0.23p3=0.38p4=0.49 |
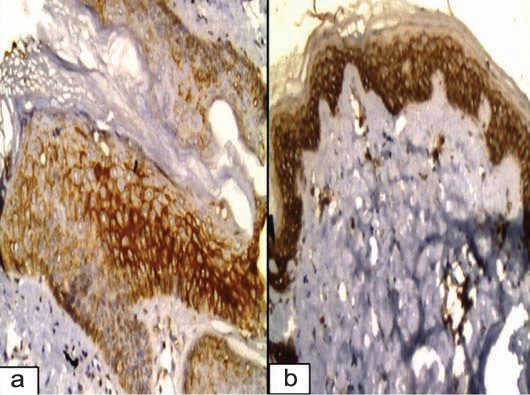
GLUT-1 expression in normal skin showing a) Membranocytoplasmic patchy immunoreactivity distributed in the basal and suprabasal epidermis (Immunoperoxidase 20X). b) Membranocytoplasmic GLUT-1 is diffusely distributed in all epidermal layers (Immunoperoxidase 20X).
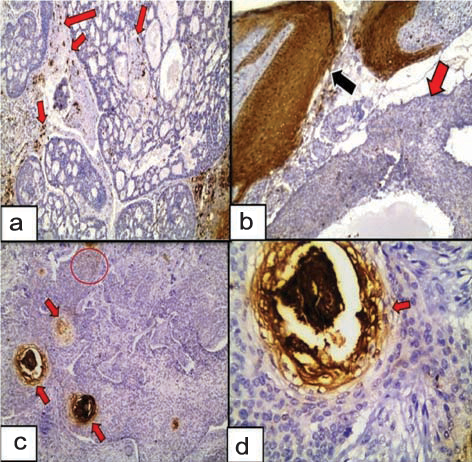
a) Adenoid BCC negatively expressed HIF-1α in tumour nests with positive expression in inflammatory infiltrates and the intervening stroma (red arrows) (Immunoperoxidase 4X); b) Cytoplasmic and nucleocytoplasmic expression of HIF-1α in the overlying epidermis (black arrow) of BCC (red arrow). Tumour nests show positive patchy nucleocytoplasmic expression (Immunoperoxidase 10X); c) HIF-1α expression in a keratotic BCC showing cytoplasmic immunoreactivity in the basaloid cells (red circle) and in the foci of keratotic differentiation (red arrows), while sparing the vast majority of the tumour nests (Immunoperoxidase 10X); d) Higher power showing the cytoplasmic localization of HIF-1α in the area of keratotic differentiation (Immunoperoxidase 40X).
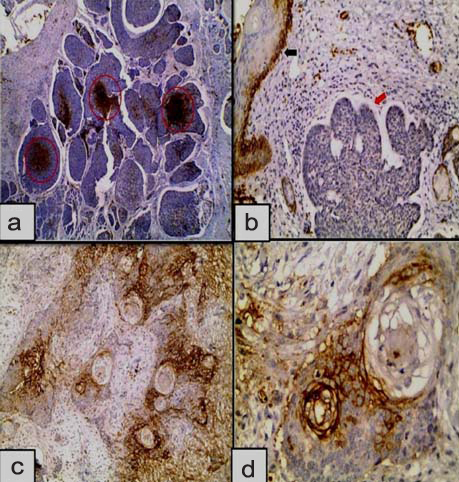
a) GLUT-1 expression in nodular BCC mainly occupies the central part of each nodule (red circles) (immunoperoxidase 4X);b) Membranous GLUT-1 expression confined to the basal layer of epidermis (black arrow) overlying nodular BCC (red arrow). |iInflammatory cells show positive immunoreactivity (immunoperoxidase 10X);c) GLUT-1 expression in keratotic BCC, mainly at the central part around areas of keratotic differentiation of each tumour island (Immunoperoxidase 20X);d) Higher power showing membranous GLUT-1 around keratotic differentiation while sparing the basaloid cells (Immunoperoxidase 40X).
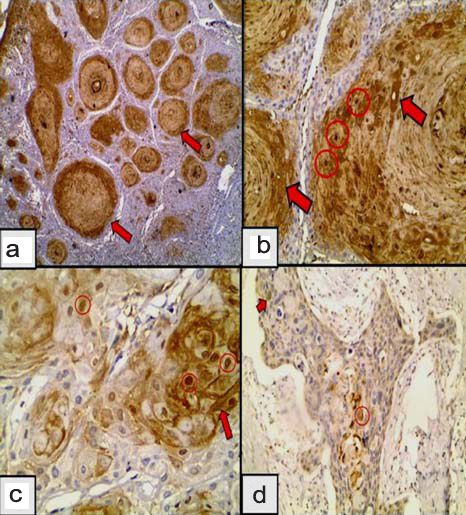
a) HIF-1α expression in well differentiated SCC showing diffuse, central and peripheral immunoreactivity (red arrows). Inflammatory and stromal cells show positive expression (Immunoperoxidase 4X); b) Higher power showing nuclear (red circles) and cytoplasmic (red arrows) expression of HIF-1α in well differentiated nests of SCC (Immunoperoxidase 20X); c) Nuclear (red circles) and nucleocytoplasmic (red arrow) expression of HIF-1α in moderately differentiated SCC (Immunoperoxidase 4X); d) Nuclear (red circle) and cytoplasmic (red arrow) expression of HIF-1α in the nest of poorly differentiated SCC (Immunoperoxidase 20X).
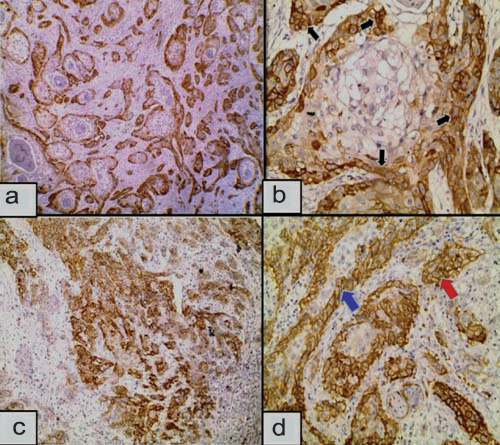
a) Confinement of GLUT-1 to the periphery of tumour islands in well differentiated SCC (Immunoperoxidase 4X); b) GLUT-1 in moderately differentiated SCC; shows membranocytoplasmic (black arrows) immunoreactivity confined to the periphery of the tumour islands sparing the centre (Immunoperoxidase 40X); c) Membranous GLUT-1 in poorly differentiated SCC (Immunoperoxidase 4X); d) Poorly differentiated SCC exhibiting membranous GLUT-1 occupying the periphery (blue arrow) or centre and periphery of the tumour islands (Immunoperoxidase 4X).
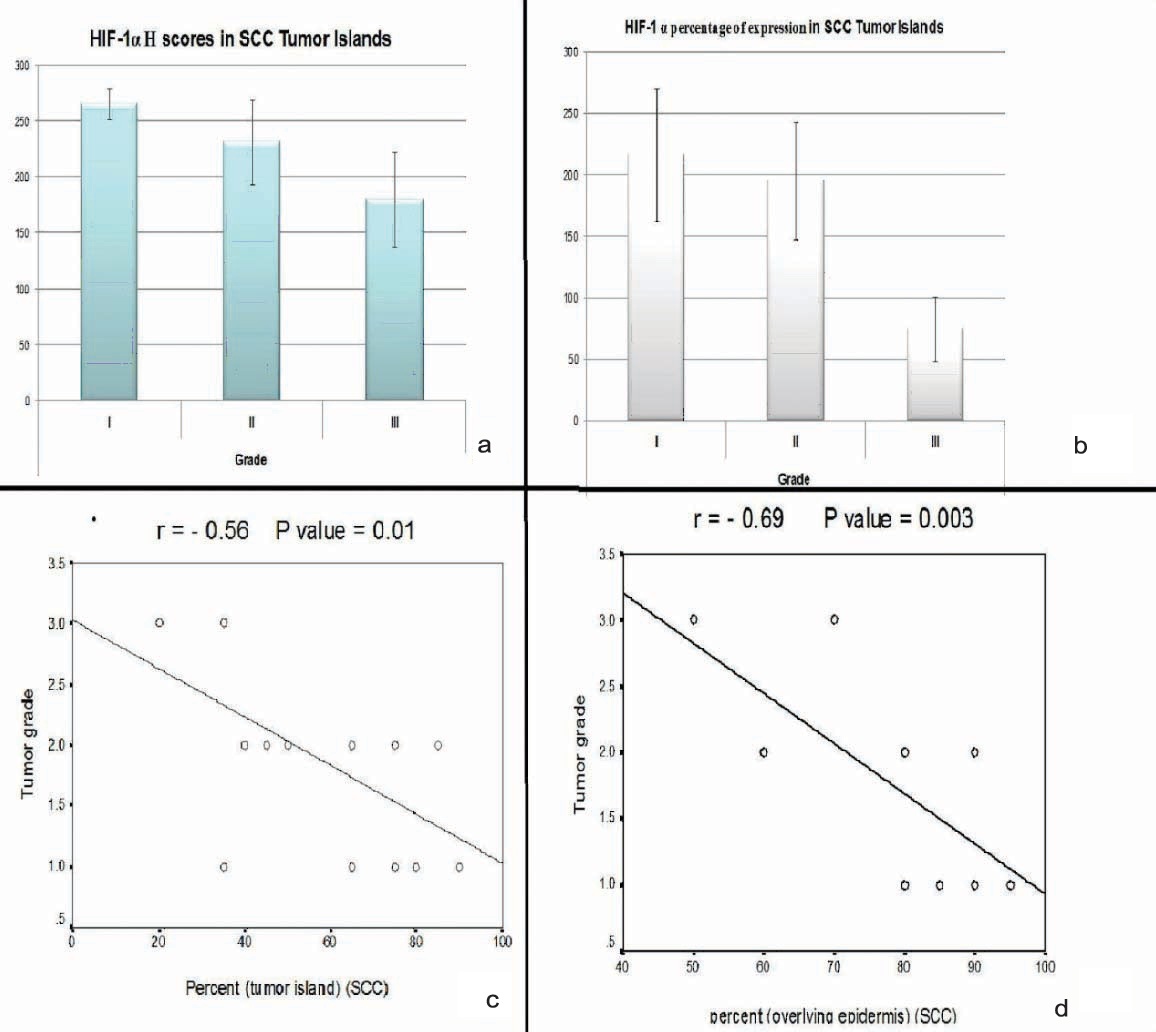
(a,b) significant association between higher H score and percent values of HIF-1α and grade I SCC; (c,d) Negative correlation between H score and percent values of HIF-1α and tumour grade.
Comparison between studied groups with regard to HIF-1α and GLUT-1 Expression
Basal Cell Carcinoma cases versus Normal skin: Comparing the epidermis overlying BCC and normal epidermis demonstrated that higher expression percentage, higher H score value (p<0.001 for both), nuclear and nucleocytoplasmic immunoreactivity (p=0.01) of HIF-1α were significantly associated with BCC. Comparing tumour islands and normal epidermis showed that higher H score (p=0.001) and higher expression percentage (p=0.02) of HIF-1α were significantly associated with BCC [Table/Fig-2].
Regarding GLUT-1 immunoreactivity, the overlying epidermis of normal skin showed more diffuse GLUT-1 expression (p=0.004) with basal and suprabasal localization (p=0.001). Membrano-cytoplasmic pattern was significantly associated with normal skin (p<0.001). Comparing tumour islands and normal epidermis showed that GLUT-1 expression (p=0.02) and expression percentage (p<0.001) were significantly higher in normal epidermis. Membrano-cytoplasmic pattern was significantly associated with normal skin (p<0.001) [Table/Fig-4].
Squamous cell carcinoma cases versus normal skin: Higher expression percentage of HIF-1α, higher H score value (p<0.001 for both), nucleocytoplasmic immunoreactivity (p=0.02), and diffuse distribution (p=0.002) were significantly associated with the overlying epidermis in SCC cases. Comparing HIF-1α immunoreactivity in tumour islands versus normal epidermis showed that higher expression percentage, higher H score value (p<0.001 for both), diffuse distribution (p=0.003) and nucleocytoplasmic immunoreactivity (p=0.008) were significantly associated with SCC [Table/Fig-2].
In overlying epidermis, GLUT-1 expression percentage (p=0.01), membrano-cytoplasmic pattern, basal and suprabasal immunoreactivity (p<0.001 for both) were significantly associated with normal skin. Comparing tumour islands and normal epidermis showed that membranous pattern was significantly associated with SCC cases (p<0.001) [Table/Fig-4].
Basal cell carcinoma versus squamous cell carcinoma: In overlying epidermis, higher expression percentage of HIF-1α (p=0.02) and higher H score value (p=0.01) were significantly associated with SCC. In tumour islands, higher expression, higher expression percentage, higher H score value (p<0.001 for all), central and peripheral immunoreactivity (p=0.006) and diffuse staining (p=0.002) were significantly associated with SCC [Table/Fig-2].
Regarding GLUT-1 immunostaining in overlying epidermis, there was no significant difference in any of the studied parameters. In tumour islands, GLUT-1 expression (p= 0.02), higher expression percentage, higher H score, peripheral immunoreactivity and diffuse staining (p<0.001 for all) were significantly associated with SCC compared with normal skin [Table/Fig-4].
NMSC cases (BCC+SCC) versus normal skin: In overlying epidermis, HIF-1α immunostaining showed that higher expression percentage (p=0.02), higher H score (p=0.01), nucleocytoplasmic pattern (p=0.001) and diffuse staining (p=0.009) were significantly associated with NMSC cases. Comparing HIF-1α immunoreactivity in tumour islands versus normal epidermis showed that higher expression percentage, higher H score (p<0.001 for both), nucleocytoplasmic pattern (p=0.003) and diffuse staining (p=0.04) were significantly associated with NMSC cases [Table/Fig-2].
GLUT-1 expression percentage (p<0.001) in the overlying epidermis was down regulated in NMSC cases compared with normal skin. Membranous pattern and basal and suprabasal immunoreactivity (p<0.001 for both) were significantly associated with normal skin. Comparing tumour islands and normal epidermis showed that, expression percentage (p=0.004) was down regulated in NMSC cases. Membranous pattern was significantly associated with NMSC cases (p<0.001) [Table/Fig-4].
Relationship between expression percentage and H score values of HIF-1α and GLUT-1 and clinicopathologic parameters of studied cases:
Basal cell carcinoma: No significant association was detected between H score and expression percentage values of HIF-1α and GLUT-1 and clinical (age of cases, gender, disease duration, lesion size, lesion site) or pathological (histopathological type, involvement of surgical margin) parameters of studied cases. No significant correlation was detected between HIF-1α and GLUT-1 expression percentage or H score values and age of cases or size of tumour in studied cases whether in overlying epidermis or in tumour islands.
Squamous cell carcinoma: Higher H score values and expression percentage were significantly associated with Grade I tumours (p=0.02 for both) [Table/Fig-10a,b]. Significant negative correlation was detected between H score values (r=-0.6, p=0.003) and expression percentage (r=-0.5, p=0.01) and tumour grade [Table/Fig-10c,d].
Regarding GLUT-1 immunostaing, higher expression percentage and H score values were significantly associated with lesions on extremities (p=0.03 for both). No significant correlation was found between expression percentage or H score values and both age of patients, size and grade of the tumour whether in overlying epidermis or in tumour islands (data not shown in tables or figures).
Relationship between pattern of HIF-1α and GLUT-1 and clinicopathologic parameters of studied cases: No significant association was demonstrated between their patterns of expression and clinical or histopathological characters of studied BCC and SCC cases.
Correlation between H score and percent values of GLUT-1 and HIF-1α in studied cases: No significant correlation was found between H score or expression percentage values of both of them in tumour islands or in overlying epidermis in BCC and SCC.
Discussion
HIF-1α expression: In the current study, HIF-1α was expressed in basal and suprabasal layers in 90% of normal skin biopsies. To the best of our knowledge, HIF-1α expression has not been studied before in normal skin. Its expression in normal tissues showed controversial findings. Some previous studies reported absent expression of HIF-1α in normal tissues including prostate [19-21] breast [22,23] and kidney [24,25]. Giatromanolaki A et al., reported weak or negative reactivity of normal lung tissue and areas distal to malignant lung neoplasm [26] and Yoshimura H et al., reported weak normal colorectal mucosal cell staining of HIF-1α [27].
The current finding can be explained by the need of epidermal HIF-1 to help in cellular adaptation to hypoxia. This is because the epidermis is avascular while dermal oxygen demand is satisfied by dermal vasculature [28].
Going with our finding, Bedogni et al., reported that human and mouse skin includes areas with low oxygen content, demonstrated in their study by positive carbonic anhydrase IX and 2-nitroimidazole EF5 immunoreactivity which correlate with GLUT-1 [29]. These markers correlate with GLUT-1 staining, a well known HIF-1α direct target gene.
In addition, HIF-1α has a key biological role in defense against invasive microorganisms, since Peyssonnaux1 C et al., demonstrated its role in supporting inducible cathelidin production and its consequent antibacterial activity through in vitro studies in cultured human keratinocyte cell lines [28].
GLUT-1 expression: GLUT-1 was expressed in all normal skin biopsies with basal and suprabasal localization in all examined sections. Our results are concordant with Parente E et al., [30]. Gherzi R et al., [31] detected GLUT-1 expression in the basal layer and to a lower extent in the immediately suprabasal layer of the epidermis with decreased immunoreactivity in upper epidermal layers. Authors postulated that GLUT-1 immunoreactivity gradually declines with cell cornification while Voldstedlund and Dabelsteen came to a conclusion that epidermal GLUT-1 immunoreactivity is mainly due to glucose consumption by keratinocytes which depends on glycolysis [32]. On the other hand, Yuan SM et al., reported complete absence of GLUT-1immunoreactivity in normal skin [33]. Therefore, the expression of GLUT-1 in proliferating and differentiating cells is a matter of debate for further investigation.
The prevalence of membranocytoplasmic expression of GLUT-1 in the normal epidermis, in the current study, could be attributed to the series of changes in GLUT-1 upon exposure to hypoxic conditions as has been reviewed by Zhang J et al., [34]. The sequence of events begin with unmasking of GLUT-1 with increase in glucose binding followed by additional stimulation with hypoxia, which causes protein translocation from cytoplasm to cell membrane with increase in GLUT-1 mRNA synthesis [35]. Therefore, membranous immunoreactivity was considered as an indicator of hypoxia according to earlier reports [36-38].
In the current study, HIF-1α was up regulated in NMSC cases compared with normal skin. This may be due to excessive tumour proliferation that is adapted to hypoxia by activation of anaerobic metabolism and induction of angiogenesis [39]. Furthermore, with low oxygen content, HIF-1α interacts with p53 causing an increase in p53 half-life and a decrease in HIF-1α half-life [40]. The HIF-1α mediated stabilization of p53 may contribute to hypoxia mediated apoptosis and p53 loss of function. HIF-1α also increases the expression of VEGF and thus promotes angiogenisis [41].
HIF-1α was not investigated before in NMSC. However, going with our findings, Kurokawa T et al., [42] detected HIF-1α up regulation in oral SCC. HIF-1α was also found to be overexpressed in carcinomas of different organs including nasopharyngeal carcinoma [43] ovarian carcinoma [44] bladder adenocarcinoma [45], gastric carcinoma [46], pancreatic carcinoma [47] renal cell carcinoma [25] and hepatocellular carcinoma [48].
GLUT-1 was down regulated in NMSC cases compared with normal skin. Our results are on the contrary to previous reports that stated overexpression of GLUT-1 in various human tumours [49,50]. However, going with our findings, Parente et al., reported that GLUT-1 is down regulated in 55% of malignant melanomas compared to melanocytic and Spitz nevi [30]. Hauptmann S et al., showed that GLUT-1 in colorectal adenocarcinoma cell lines is inversely correlated with tumour cell proliferation [51]. Therefore, we can postulate that, although GLUT-1 is a proproliferative, it could be down regulated in hyperproliferative disorders in an attempt to compensate for the tumour growth and/or there might be factors other than hypoxia and ischemia regulating GLUT-1 expression.
The current work showed significant difference between SCCs and BCCs regarding HIF-1α and GLUT-1 expression, since higher expression percentage and H score values of both GLUT-1 and HIF-1α, were in favor of SCC. Therefore, the high proliferative index, the infiltrative and rapidly destructive nature of SCC may contribute to an evident hypoxic environment, in comparison to BCC, which is an important regulator of both HIF-1α and GLUT-1.
The demonstrated nucleocytoplasmic immunoreactivity of HIF-1α in 100% and 85% of our BCC and SCC cases respectively and the nuclear pattern in 15% of SCC cases may be due to the cytoplasmic-nuclear trafficking of the HIF-1α and its protein fusion between normal and tumour cells. Under normal oxygen tension, von Hippel Lindau protein (pVHL) is engaged in a constitutive shuttling between nucleus and cytoplasm. The subcellular localization of HIF-1α depends on pVHL. However, it has not been fully established whether proteasomal degradation of HIF-1α occurs in the nucleus, in the cytoplasm, or in both compartments. Prior reports are somewhat contradictory [52].
Di Cristofano C et al., detected strong nuclear localization of HIF-1α in clear renal cell carcinoma with reduced pVHL trafficking [53]. The same was detected by Bos R et al., in ductal carcinoma in situ of the breast [22] and by Kurokawa T et al., in oral SCC [42]. In these studies, nuclear staining was coupled with increased degree of malignancy and short survival. In the current work, no significant association was demonstrated between nuclear immunoreactivity and tumour grade, tumour stage or lymph node involvement in SCC cases.
GLUT-1 showed membranous and membrano-cytoplasmic patterns of immunoreactivity in BCC and SCC tumour islands, included in the current work. Ariely R et al., suggested that co-localization of GLUT-1 with the Golgi leads to combined membrane and cytoplasmic expression [54]. Baer SC et al., and Ayala FR et al., demonstrated membranous expression in cutaneous and oral SCCs respectively [49,50]. Takanaka H and Frommer WB concluded that GLUTs mediate endoplasmic reticulum glucose transport en route to the plasma membrane [55].
The positive HIF-1α expression in inflammatory cells in BCC and SCC cases, demonstrated in the current work, can be explained by the effect of HIF-1α on T cell differentiation that was demonstrated by Dang EV et al., [56]. In addition, HIF-1α has role in host immune response through recognition of Pathogen-Associated Molecular Patterns (PAMPs) such as Lipopolysaccharides (LPS) by Toll Like Receptors (TLRs) in human monocytes [57].
The positive stromal immunoreactivity for GLUT-1 and HIF-1α in BCC and SCC cases was not reported previously. However, Pinkus H mentioned that, as the connective tissue stroma proliferates with the tumour and is arranged in parallel bundles around the tumour masses, a mutual relationship seems to exist between the parenchyma of the tumour and its stroma [58]. In addition, the expansion and growth of tumour masses may occur on the expense of stromal cells which may suffer from hypoxia as well.
In the present work, adnexal structures in BCC and SCC showed positive HIF-1α and GLUT-1 immunoreactivity. The significance of this finding is not clear. However, Parente P et al., reported GLUT-1 expression in the eccrine ducts and the perineurium of the small nerve trunks of normal skin, nevi and malignant melanoma [30]. Voldstedlund M and Dabelsteen E showed GLUT-1 expression in ductal and myoepithelial cells of minor salivary glands and perineural sheath located in the lamina propria of oral mucosa [32]. Further studies are needed to clarify its significance.
A significant association between higher H score values of HIF-1α expression and Grade I in SCC cases was detected in our results. Significant negative correlation was also noted between H scores and tumour grade. Similarly, an inverse correlation was shown with tumour differentiation in hepatocellular carcinoma [59] and ovarian carcinoma cases [60]. Nevertheless our finding may be considered as a good prognostic sign as postulated by Fillies J et al., [61] On the contrary, Korkolopoulou P et al., found that HIF-1α protein expression is increased significantly with increasing grade and proliferative potential in astrocytomas [62].
The current study demonstrated the presence of GLUT-1 mainly in the central portion of malignant basaloid nests. A similar finding was reported by Youssef KK et al., who suggested that this may be related to focal keratinization in BCC as an indicator of follicular differentiation [63]. In addition, Oliver RJ et al., suggested that GLUT-1 staining in central tumour nests, distal to blood vessels, may signify the existence of hypoxia-induced GLUT-1 [64].
The presence of GLUT-1 mainly in the peripheral part of tumour nests in SCC is similar to Oliver RJ et al., who demonstrated that, GLUT-1 staining occurs in outer epithelial layers as a function of the invasion process [64]. Ayala FR et al., demonstrated that, GLUT-1 expression was observed in the majority of poorly differentiated cases of oral SCC in central and perinecrotic zones, while well-differentiated SCC showed absent GLUT-1 staining in the central zones of the tumour, with its expression localized in the peripheral neoplastic area [50].
The positive HIF-1α mainly in central parts of BCC and SCC tumour islands went with the report of Fillis T et al., who showed that HIF-1α expression is usually diffuse and tended to be more prominent towards the centre of tumour fields [61].
The significantly higher H score values of GLUT-1 in SCC extremities’ lesions was not reported previously but can be explained by the earlier observation that sun exposure induces an up regulation of GLUT-1 gene expression [65].
Absence of a significant correlation between HIF-1α and GLUT-1 in both BCC and SCC has been demonstrated by Koukourakis MI et al., in colorectal carcinoma [66] and Schrijvers ML et al., in laryngeal carcinoma [67].
limitation
Results of this study may not be completely generalizable because the small sample size.
Conclusion
In conclusion, HIF-1α may have a role in NMSC pathogenesis through adaptation to hypoxia which results from excessive proliferation. GLUT-1 down regulation in NMSC may be explained by its consumption by proliferating tumour cells. The expression of HIF-1α and GLUT-1 in normal skin requires further investigation. The positive stromal and adnexal immunoreactivity to both HIF-1α and GLUT-1 and the up regulation of GLUT-1 in peripheral SCC lesions also needs further research.