Introduction
Knowledge of normal range of size and volume of abdominal organs plays a vital role in clinical practices as various medical conditions affects the abdominal organs causing alteration in their dimensions.
Aim
The present retrospective study was done to establish the normal range of renal volume in study population and to see the correlation between renal volume and body weight of an individual.
Materials and Methods
Computed tomographic evaluations of kidneys were performed on 140 kidneys of 70 individuals who had undergone abdominal CT scan for indications other than renal disease. We also excluded the patients diagnosed to have renal cysts, hydronephrosis or other renal diseases on CT examination. Renal length, width and depth were measured. Renal volume of both the kidneys was calculated by formula Kidney Volume (KV) =Л/6 x Renal length (L) x Renal width (W) x Renal depth (D). Various body parameters like age, weight, sex were also recorded in the data sheet.
Results
Mean renal volume for the right kidney was 83.26±18.33 cm3 for females (33 females out of 70) and 103.92±23.27 cm3 for males (37 males out of 70). However, mean renal volume for the left kidney was 89.17±19.41 cm3 in females and 106±26.79 cm3 in males. Left renal volume was apparently more than right renal volume, though statistically insignificant. In males, mean kidney volume was found to be 104.96 cm3 whereas in females, it was found to be 86.21 cm3. Kidney volume was found to be significantly greater in males than females among study population (t=3.79, p=0.0001). Renal volume significantly correlated with age and body weight of an individual.
Conclusion
This study is a sincere attempt to establish a normograms of renal volume in study population. For the clinical assessment of renal pathologies, knowledge of renal volume is a vital parameter. In study group, most significant parameter associated with renal volume is body weight which can be used as an adjunct while evaluating renal pathological conditions. Of all the radiological imaging techniques, abdominal coronal computed tomography scan provides most accurate renal measurements.
Introduction
There exists a potential significance in knowing the volume and size of abdominal organs. Since multitude of medical conditions are closely linked with the alteration in organ dimensions leading to changes in their volume and size [1]. Systemic diseases like hypertension, diabetes mellitus, micro and macro vascular diseases, various congenital anomalies, urinary tract diseases leads to changes in renal dimensions and thus acts as an important sign of renal diseases [2,3]. Thus, essential prerequisite to diagnose any renal disease is first to have knowledge about normal ranges of renal dimensions which can be used to calculate renal volume. Kidney volume being more sensitive index of renal size for diagnosing renal pathology, we used this parameter in our study. Moreover, renal volume is considered to be an excellent parameter in predicting the renal function which is found to be correlated very well with body indexes [4-6]. In the renal transplant patient’s prognosis of the graft kidney depends upon pretransplant renal volume [7]. Pourmand G et al., reported that when the donor graft mass is inferior to recipient’s Body Mass Index (BMI), rate of acute allograft rejection phenomenon is raised [8].
Most recent imaging methods used to measure normal renal volume is ultrasonography, computed tomography and Magnetic Resonance Imaging (MRI) [9-12]. On comparing these three recent imaging techniques, sonographic measurements of organs is demonstrated to be underestimated when they are compared with measurements taken by CT and MRI [11,13]. Thus, we assessed the renal dimensions using CT images due to its ready availability as compared to MRI.
Renal dimensions give an idea about the health status of kidney. Changing renal dimensions between successive examinations form a vital parameter while evaluating and taking the follow up of patients with renal pathology [14]. Thus, present study aimed to determine the renal volume calculated using renal dimensions (using CT) and to explore its association with the body weight of an individual.
Materials and Methods
This was the prospective observational study carried out in the Department of Anatomy and Outpatient Department of Radiodiagnosis, Mahatma Gandhi Institute of Medical Sciences, Sevagram, Wardha, Maharashtra, India. We have taken approval from Institutional Ethical Committee and also obtained informed consent from the study group for study protocol. We studied 70 consecutive patients above the age of 18 years who had undergone abdominal CT scan from March 2015 to November 2016 for indications other than renal pathology. The study group included outpatients and in patients undergoing abdominal CT examinations due to common clinical complaints such as abdominal pain, loss of weight, constipation, vomiting not suggestive of renal involvement. We also have seen the patient’s medical record and subjects with underlying disease such as hypertension; diabetes mellitus were excluded from the study. Moreover, subjects diagnosed to have renal disease on CT examination were also excluded from the study.
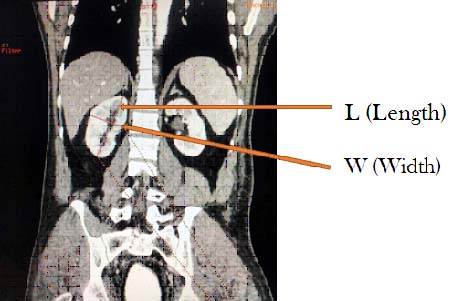
Computed tomographic evaluation: All the seventy subjects were evaluated with a contrast enhanced abdominal CT scan. Linear dimensions of kidney such as renal length (L), renal width (W) and renal depth (D) were measured. Renal length (L) was the maximum longitudinal length of the kidney determined on the coronal slice parallel to the long axis of kidney [Table/Fig-1].
Abdominal CT scan-coronal section.
Abdominal CT scan-sagittal section.
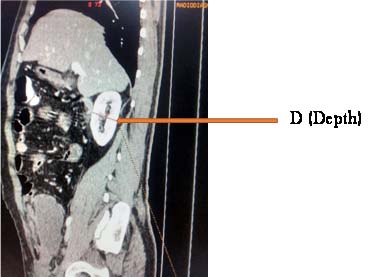
Renal Width (W) was determined as maximum width perpendicular to the renal length on the identical slice of CT where renal length was localized [Table/Fig-1]. Renal Depth (D) was calculated as maximum depth of kidney right angled to the renal length in a thick sagittal slice of CT scan image [Table/Fig-2]. Kidney Volume (V) was calculated using the formula as Kidney volume (V) =Л/6 x L x W x D [15]. Apart from recording renal dimensions, subject’s age, sex and weight were also recorded.
Statistical Analysis
Results were calculated as mean ± SD. t-test was used to analyse the relation between left and right kidneys. Pearson’s correlation coefficient was used to evaluate the relationship between different parameters. When p-value was below 0.05, the obtained results were considered to be significant. Coefficient of determination (R2) was used to establish any significant relationship if any between the different parameters and were used to derive equations. Scatter graphs were also prepared showing significant relationship between parameters. Statistical analysis was done using SPSS 17.0 version and Graphpad Prism 6.0 version.
Results
One hundred and forty kidneys of 70 individuals were included in the present study. There were 37 males (52.9%) and 33 females (47.1%). Their age ranged from 21 years to 79 years with mean age of 46.94±17.98 years in males and 47.09±15.49 years in females. Weight of study group ranged from 30 kg to 77 kg with mean weight of 51.48±9.77 kg in males and 46.72±9.27 kg in females. Mean weight of study group was 49.24±9.77 kg. Mean body weight of males was greater than that of females in study group (t=4.33, p=0.041) [Table/Fig-3].
Somatic variables of the study population.
| Variables | Male | Female TI | Combined | t-value | p-value |
|---|
| No of subjects | 37(52.9%) | 33(47.1%) | 70 | | |
| Mean Age(yrs) | 46.94±17.98 | 47.09±15.49 | 47.01±16.73 | 0.36 | 0.971,NS |
| Mean Weight(kg) | 51.48±9.77 | 46.72±9.27 | 49.24±9.77 | 4.33 | 0.041,S |
Student’s unpaired t-test used.
Mean renal volume for the right kidney was 83.26±18.33 cm3 for females and 103.92±23.27 cm3 for males. However, mean renal volume for the left kidney was 89.17±19.41 cm3 in females and 106±26.79 cm3 in males. We also calculated the mean renal volume for right kidney and left kidney as 94.18±23.68 cm3 and 98.07±24.92 cm3 respectively in combined study group consisting of both males as well as females. We observed that left kidney volume was apparently larger than right kidney volume, though statistically insignificant (t=0.94, p=0.34) [Table/Fig-4].
Distribution of renal volume in males, females and combined group.
| Male | Female | Combined |
|---|
| Rt Kidney | Lt Kidney | Rt. Kidney | Lt. Kidney | Rt. Kidney | Lt Kidney |
|---|
| Renal volume | 103.92± 23.27 | 106± 26.79 | 83.26± 18.33 | 89.17± 19.41 | 94.1823.68 | 98.0724.92 |
| t-value,p- value | 0.35,p=0.72,NS | 1.27,p=0.28,NS | 0.94,p=0.34,NS |
Student’s unpaired t-test used
In males, mean kidney volume was found to be 104.96 cm3 whereas in females it was found to be 86.21 cm3. Kidney volume was found to be significantly greater in males than females among study population (t=3.79, p=0.0001) [Table/Fig-5]. Left renal volume showed significant inverse relationship with the age of an individual (p=0.007) where right kidney volume showed apparently inverse relationship with the age of an individual which was statistically insignificant (p=0.133). In males, left kidney volume presented statistically negative correlation with age of an individual (p=0.009) whereas in females, right renal volume showed significant negative correlation with individual’s age (p=0.039) [Table/Fig-6].
Relationship between kidney volume and body parameters.
| Gender | N | Mean renal volume | Std. Deviation | Std. Error mean | t-value | p-value |
|---|
| Male | 37 | 104.96 | 23.23 | 3.81 | 3.79 | 0.0001,S |
| Female | 33 | 86.21 | 17.20 | 2.99 | | |
Student’s unpaired t-test used
Relationship between kidney volume and body parameters.
| Male | Female | Combined |
|---|
| Kidney Volume | Kidney Volume | Kidney Volume |
|---|
| Right | Left | Right | Left | Right | Left |
|---|
| Age | -0.129 | -0.421 | -0.355 | -0.198 | -0.181 | -0.321 |
| p-value | 0.52,NS | 0.009,S | 0.039,S | 0.27,NS | 0.133,NS | 0.007,S |
| Weight | 0.193 | 0.372 | 0.336 | 0.416 | 0.323 | 0.434 |
| p-value | 0.25,NS | 0.024,S | 0.057,NS | 0.016,S | 0.006,S | 0.0001,S |
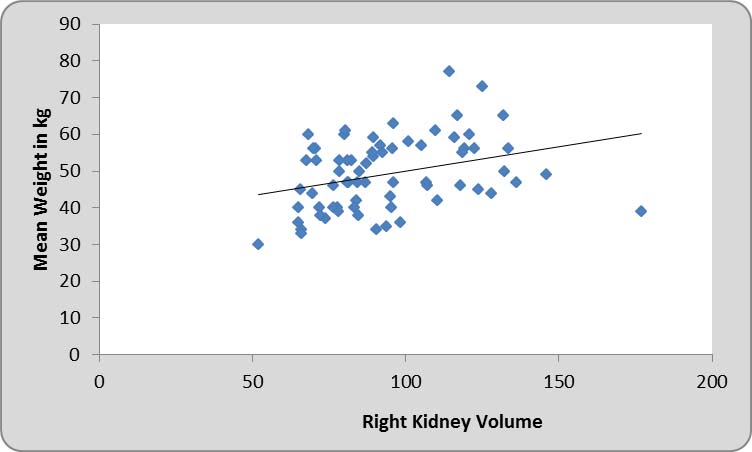
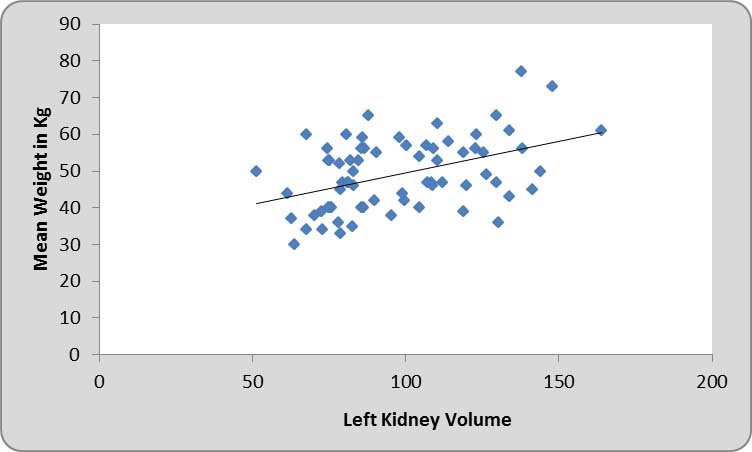
We observed significantly positive linear relationship between individual’s body weight and renal volume (For right renal volume, p=0.006 and for left renal volume, p=0.0001) in combined group consisting of males and females [Table/Fig-6,7 and 8].
Distribution of mean body weight versus right kidney volume.
Distribution of mean body weight versus left kidney volume.
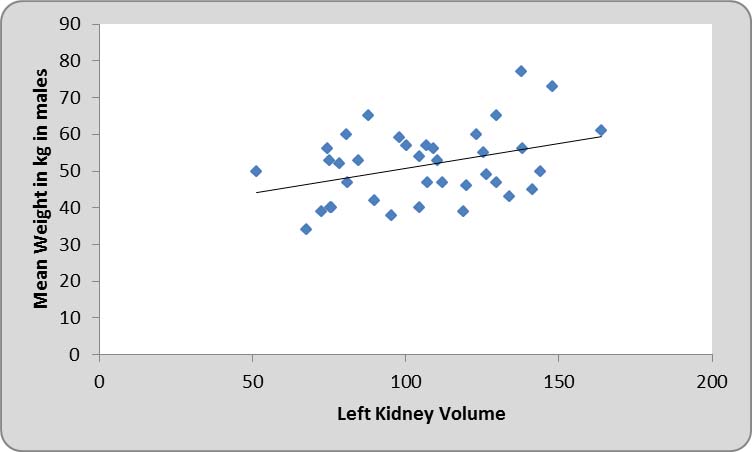
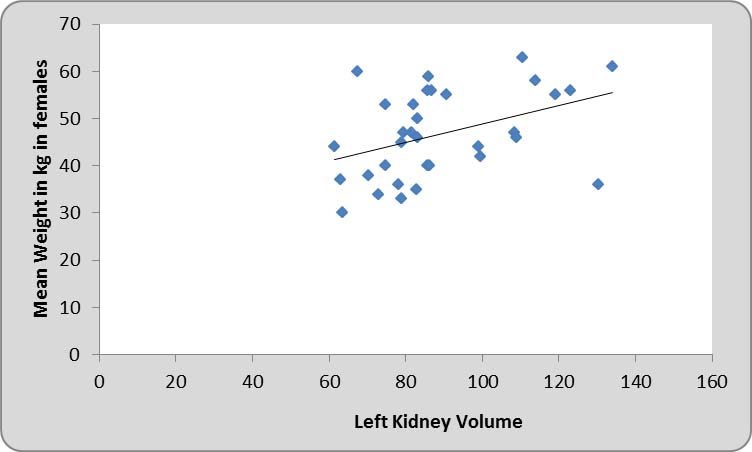
Left kidney volume presented statistically positive linear correlation with the weight of an individual in males (p=0.024) as well as in females (p=0.016) [Table/Fig-6,9,10]. Mean right kidney volume in subjects aged less than 60 years was found to be 94.94±22.07 cm3 and in subjects aged more than 60 years was found to be 92.27±27.86 cm3 (t=0.42, p=0.67) whereas mean left kidney volume in subjects aged less than 60 years was 101.96±24.25 cm3 and more than 60 years was 88.33±24.47 cm3 (t=2.11, p=0.038). Thus, we noted the statistically significant differences in left kidney volume among the subjects less than 60 years and more than 60 years.
Distribution of mean body weight in males versus left kidney volume.
Distribution of mean body weight in females versus left kidney volume.
Furthermore, linear regression equations for predicting variable (Renal volume) from independent variable (Weight) were derived as follows:
Right renal volume= 55.56+0.78×weight (R2 =0.10)
Left renal volume = 43.51+1.10×weight (R2 =0.18)
Discussion
Estimation of renal volume has determined to be a most sensitive parameter in detecting renal pathology as compared to any other single linear measurements of kidney and found to be correlated better with renal mass. Furthermore renal volume has been shown to correlate very well with number of functioning nephron thus reflecting over the renal functions [10,16]. Thus, the most sensitive index of kidney size for detecting renal abnormalities is renal volume. However, because of the complex renal shape there occurs a difficulty in assessing the renal volume [17,18].
In our study we calculated the renal volume using the formula Л/6x L x W x D. Mean renal volume for right kidney and left kidney was 94.18±23.68 cm3 and 98.07±24.92 cm3 respectively in combined study group consisting of both males as well as females. Different studies carried out in past using different imaging modalities represented different values of renal volumes [Table/Fig-11] [6,10,15,16,19-23]. The mean renal volume calculated in the present study was smaller than that reported in most of the previous studies but it coincided with study carried out in Pakistan [16, 21]. In an autopsy study carried out by Caglar V et al., involving 114 adult males in Turkey, calculated mean kidney volume was 149.7±48.1ml [1]. In living kidney large amount of blood circulates through it thus results of cadaveric or autopsy study cannot be compared with radiological interventions conducted on living subjects [24].
Comparison between different geographical studies [6,10,15,16,19-23].
| Different geographical studies | Geographical area | Population of study group | Mean renal volume | Imaging modality | Comparison of renal volume with respect to gender | Comparison between right and left renal volume |
|---|
| Okur A et al., [6] | Turkey | 152 | Right 158±39 cm3 Left 168±40 cm3 | USG | Male > Female | Left renal volume>Right renal volume |
| Shin HS et al., [10] | Korea | 113 | Right 203.26±38.60 cm3 Left 207.32±37.50 cm3 | CT | -- | Left renal volume>Right renal volume |
| Breau RH et al., [15] | Ottawa, Canada | 28 | 170-186 cm3 | CT | -- | -- |
| Raza M et al., [16] | Islamabad, Pakistan | 4035 | Right 99.8±37.2 cm3 Left 124.4±41.3 cm3 | USG | Male > Female | Left renal volume>Right renal volume |
| Rasmussen SN et al., [19] | Copenhagen, Denmark | 46 | 4.3-8.0 ml/kg | USG | No difference | No difference |
| Emamian SA et al., [20] | Copenhagen, Denmark | 665 | Right 134 cm3 Left 146 cm3 | USG | Male > Female | Left renal volume>Right renal volume |
| Buchholz NP et al., [21] | Karachi, Pakistan | 194 | Right 70±20 cm3 Left 82±24 cm3 | USG | Male > Female | Left renal volume>Right renal volume |
| Cheong B et al., [22] | Texas, United States | 150 | Right 166±29 ml (male) 130±30 ml (female) Left 168±28 ml (male) 131±33 ml (female) | MRI | Male > Female | -- |
| Rathore RS et al., [23] | Kerala, India | 84 | Right 130.38±16.82 ml (male) 123.56±19 ml (female) Left 143±20.67 ml (male) 132±21.26 ml (female) | CT | Male > Female | Left renal volume>Right renal volume |
| Present study | Maharashtra, India | 70 | Right 94.18±23.68 cm3 Left 98.07±24.92 cm3 | CT | Male > Female | Left renal volume>Right renal volume |
In the present study, left kidney volume was greater than right kidney volume, though statistically insignificant. Best possible explanation is that spleen present on left side of abdomen has smaller size than liver on the right side of abdomen thus providing larger space for the growth of left kidney. Also the length of left renal artery is smaller than right renal artery thus raised blood flow through left renal artery leads to relatively larger left renal volume [6]. In most of the studies, researchers determined Left renal volume significantly greater than right Renal volume [Table/Fig-11]. Thus, our study showing greater left renal volume than right renal volume was consistent with most of the previous studies. However, some authors also have reported no perceptible difference between volumes of right and left kidneys [17,19].
Our study revealed larger kidney volume in males (104.96 cm3) as compared to females (86.21 cm3) which was found to be statistically significant and it coincided with most of the previous studies [Table/Fig-11]. In contrast to most of the past researches, Rasmussen SN et al., did not notice any remarkable difference in renal volumes in relation to sex [19].
Most of the Past researchers have reported that renal volume showed negative correlation with age of an individual [6,20,25] and this coincided with the present study. Dunnill and Halley considered 68 pair of kidneys for study aged ranging from birth to 90 years and reported the combined volume of the both kidneys at birth about 20 ml and in healthy adults about 250 ml and in old age the volume declines. Thus, established an inverse relationship between kidney volume and age [26]. Prospective analysis of data from 1222 autopsies in Legal Medicine Organization of Iran showed that kidney weights declined with age [27]. Buchholz NP et al., reported that all renal dimensions increased with age till the 3rd decade, remained more or less stable through the middle age, then declined beyond the 6th decade [21]. They explained it as there occurs reduction in renal parenchyma with advancing age [20,25]. So, all the above researches favour our finding of inverse correlation between renal volumes with age. In contrast to previous studies, kidney volume was found to increase with advancing age in apparently healthy Bangladeshi people due to an increase in renal sinus fat with age compensating for the decrease in the kidney volume [17]. There was a statistically significant inverse relationship between age of an individual and left renal volume in an ultrasonographic study carried out in Pakistan involving 4035 adults which matches with our study [16].
We observed significantly positive linear relationship between individual’s body weight and renal volume (For right renal volume, r =0.323 and for left renal volume, r =0.434) in combined group consisting of males and females in the present study.
Our study is in accord with the studies conducted by most of the researchers [Table/Fig-12] [6,10,16,19,28-30]. Caglar V et al., observed that there exists positive correlation between kidney size and body weight in an autopsy study involving 114 adults [1]. Some researchers commented about failure of getting correct results on comparing autopsy study with radiological interventions conducted on living subjects as large amount of blood circulates through living kidney [24].
Comparative account of correlation between subject’s body weight I and renal volume in different geographical areas [6,10,16,19,28-30].
| Different geographical studies | Geography | correlation between subject’s body weight and renal volume | Correlation coefficient (r) |
|---|
| Okur A et al., [6] | Turkey | Positive linear correlation | r =0.32-0.44 |
| Shin HS et al., [10] | Korea | Positive linear correlation | r =0.649 |
| Raza M et al., [16] | Islamabad, Pakistan | Positive linear correlation | r =0.417 (Right) r =0.385 (Left) |
| Rasmussen SN et al., [19] | Copenhagen, Denmark | Positive linear correlation | r =0.698 |
| Dinkel E et al., [28] | Freiburg, Germany | Positive linear correlation | -- |
| Soyupak SK et al., [29] | Adana, Turkey | Correlation found | -- |
| Safak AA et al., [30] | Duzce, Turkey | Positive linear correlation | r =0.552 (Right) r =0.511 (Left) |
| Present study | Maharashtra, India | Positive linear correlation | r =0.323(Right) r =0.434(Left) |
Thus, our study fortifies the knowledge of the standard range of computed tomography-based renal volume in study population aged 21 to 79 years. Estimation of renal volume requires the measurement of all the three dimensions of kidney and is slightly time consuming procedure. In clinical practice, body weight can be recorded quickly and this somatic parameter can be easily used to calculate the renal volume in an individual using linear regression equations which was derived in the present study.
Limitation
Present study has got certain limitations. Study involved 70 healthy subjects which were free from renal disease. But some of them might have subclinical renal disease which was not evident at the time of evaluation. Moreover present study involved limited number of patients with only two reviewers. Further studies with large number of patients and reviewers are recommended to get more accurate results which authenticate our findings
Conclusion
Renal volume showed a positive correlation with the body weight of an individual. Thus body weight, somatic body parameter, can be used to estimate the renal volume. Right and left renal volumes can be calculated simply by our derived linear regression equation using body weight of an individual. Thus, renal volume of an individual acts as surrogate for renal function reserve and can be used as a diagnostic somatic body parameter in nephrologic as well as urological practices.
Student’s unpaired t-test used.
Student’s unpaired t-test used
Student’s unpaired t-test used
[1]. Caglar V, Kumral B, Uygur R, Alkoc OA, Ozen OA, Demirel H, Study of volume, weight and size of normal pancreas, spleen and kidney in adults autopsiesForensic Medicine and Anatomy Research 2014 2:63-69. [Google Scholar]
[2]. Bax L, Van der Graaf Y, Rabelink AJ, Algra A, Beutler JJ, Mali WP, SMART Study GroupInfluence of atherosclerosis on age related changes in renal size and functionEur J Clin Invest 2003 33(1):34-40. [Google Scholar]
[3]. Weisenbach J, Horvath M, Jeges S, Adamovich K, Huszar T, Normal percentiles of kidney size in children as measured by ultrasonographyOrv Hetil 2001 142:71-74. [Google Scholar]
[4]. Jones TB, Riddick LR, Harpen MD, Dubuisson RL, Samuels D, Ultrasonographic determination of renal mass and renal volumeJ Ultrasound Med 1983 2(4):151-54. [Google Scholar]
[5]. Widjaja E, Oxtoby JW, Hale TL, Jones PW, Harden PN, McCall IW, Ultrasound measured renal length versus low dose CT volume in predicting single kidney glomerular filtration rateBr J Radiol 2004 77(921):759-64. [Google Scholar]
[6]. Okur A, Serin HI, Zengin K, Erkoc MF, Tanýk S, Yýldýrým U, Relationship between kidney volume and body indexes in the Turkish population determined using ultrasonographyInt Braz J Urol 2014 40(6):816-22. [Google Scholar]
[7]. Poggio ED, Hila S, Stephany B, Fatica R, Krishnamurthi V, del Bosque C, Donor kidney volume and outcomes following live donor kidney transplantationAm J Transplant 2006 6(3):616-24. [Google Scholar]
[8]. Pourmand G, Taheri M, Mehrsai AR, Nourijelyani K, Impact of donor nephron mass on outcomes in renal transplantationTransplant Proc 2001 33:2828-29. [Google Scholar]
[9]. Bakker J, Olree M, Kaatee R, de Lange EE, Moons KG, Beutler JJ, Renal volume measurements:Accuracy and repeatability of US compared with that of MR imagingRadiology 1999 211:623-28. [Google Scholar]
[10]. Shin HS, Chung BH, Lee SE, Kim WJ, Ha HI, Yang CW, Measurement of kidney volume with multi-detector computed tomography scanning in young KoreanYonsei Med J 2009 50:262-65. [Google Scholar]
[11]. Kang KY, Lee YJ, Park SC, Yang CW, Kim YS, Moon IS, A comparative study of methods of estimating kidney length in kidney transplantation donorsNephrol Dial transplant 2007 22:2322-27. [Google Scholar]
[12]. Abdullah MB, Garelnabi MBE, Ayad CE, Abdalla EA, Establishment of references values for renal length and volume for normal adult Sudanese using MRI disc summation methodGlobal journal of medical research:D radiology, diagnostic imaging and instrumentation 2014 14(2):29-37. [Google Scholar]
[13]. Bakker J, Olree M, Kaatee R, Lange de EE, Beek FJ, In vitro measurement of kidney size:Comparison of ultrasonography and MRIUltrasound Med Biol 1998 24:683-88. [Google Scholar]
[14]. Paul L, Talhar S, Sontakke B, Shende M, Waghmare J, Renal length and its relationship with the height of an individual:A reviewIOSR Journal of Pharmacy and Biological Sciences 2016 11(2):36-40. [Google Scholar]
[15]. Breau RH, Clark E, Bruner B, Cervini P, Atwell T, Knoll G, A simple method to estimate renal volume from computed tomographyCan Urol Assoc J 2013 7(5-6):189-92. [Google Scholar]
[16]. Raza M, Hameed A, Khan MI, Ultrasonographic assessment of renal size and its correlation with body mass index in adults without known renal diseaseJ Ayub Med Coll Abbottabad 2011 23(3):64-68. [Google Scholar]
[17]. Johora F, Nurunnabi ASM, Siddiqua D, Hena H, Ara S, A Postmortem study on the volume of the human kidneyJ Dhaka Med Coll 2014 23(1):73-77. [Google Scholar]
[18]. Moorthy HK, Venugopal P, Measurement of renal dimensions in vivo:A critical appraisalIndian Journal of Urology 2011 27(2):169-75. [Google Scholar]
[19]. Rasmussen SN, Haase L, Kjeldsen H, Hancke S, Determination of renal volume by ultrasound scanningJ Clin Ultrasound 1978 6(3):160-64. [Google Scholar]
[20]. Emamian SA, Nielsen MB, Pedersen JF, Ytte L, Kidney dimensions at sonography:Correlation with age, sex, and habitus in 665 adult volunteersAm J Roentgenol 1993 160:83-86. [Google Scholar]
[21]. Buchholz NP, Abbas F, Biyabani SR, Javed Q, Talati J, Afzal M, Ultrasonographic renal size in individuals without known renal diseaseJ Pak Med Assoc 2000 50(1):12-16. [Google Scholar]
[22]. Cheong B, Muthupillai R, Rubin MF, Flamm SD, Normal values for renal length and volume as measured by Magnetic Resonance ImagingClin J Am Soc Nephrol 2007 2:38-45. [Google Scholar]
[23]. Rathore RS, Mehta N, Bansal D, Babu M, Krishnamoorthy H, Pillai B, Estimation of renal volume in transplantation donors and correlation with differential renal functions, body mass index, age and sexParipex - Indian Journal of Research 2015 4(5):139-41. [Google Scholar]
[24]. Nomasa T, The standard renal volume of Japanese boys and girls determined by three-dimensional ultrasonographyKurume Med J 2001 48(2):105-10. [Google Scholar]
[25]. Al-Khader AA, Tamim H, Sulaiman MH, Jondeby MS, Taher S, Hejaili FF, What is the most appropriate formula to use in estimating glomerular filtration rate in adult Arabs without kidney disease?Ren Fail 2008 30:205-08. [Google Scholar]
[26]. Dunnill MS, Halley W, Some observations on the quantitative anatomy of the kidneyJ Pathol 1973 110(2):113-21. [Google Scholar]
[27]. Sheikhazadi A, Sadr SS, Ghadyani MH, Taheri SK, Manouchehri AA, Nazparvar B, Study of the normal internal organ weights in Tehran’s populationJ Forensic Leg Med 2010 17(2):78-83. [Google Scholar]
[28]. Dinkel E, Ertel M, Dittrich M, Peters H, Berres M, Schulte-Wissermann H, Kidney size in childhood:Sonographical growth charts for kidney length and volumePediatr Radiol 1985 15:38-43. [Google Scholar]
[29]. Soyupak SK, Narli N, Yapicioglu H, Satar M, Sungur EH, Sonographic measurements of the liver, spleen and kidney dimensions in the healthy term and preterm newbornsEur J Radiol 2002 43:73-78. [Google Scholar]
[30]. Safak AA, Simsek E, Bahcebasi T, Sonographic assessment of the normal limits and percentile curves of liver, spleen, and kidney dimensions in healthy school-aged childrenJ Ultrasound Med 2005 24(10):1359-64. [Google Scholar]